
You open your accounting software because you need a real answer to a real question.
Can you afford to hire? Is that equipment purchase smart right now? Why does the business feel busy, but cash still feels tight?
Then you see the reports. Rows of numbers. Labels you sort of recognize. A bottom line that looks fine one month and confusing the next. It's easy to close the tab and go back to running the business.
That's the problem. Most owners don't need more accounting terms. They need translation.
Financial reports aren't just paperwork for taxes, banks, or your bookkeeper. They're the operating story of your business. They show whether sales are turning into profit, whether profit is turning into cash, and whether your company is getting stronger or just looking stronger on paper.
A lot of smart owners get stuck because they read each report by itself. They glance at the profit and loss, maybe check the bank balance, and move on. That misses the point. The numbers only make sense when the reports talk to each other.
Think about a contractor that lands a big job, invoices quickly, and shows strong revenue. On the surface, that feels like growth. But if collections lag, payroll is due, and equipment payments are piling up, the business can still feel squeezed. The reports are telling the truth. You just have to know how to read the full conversation.
That's what this guide is for. Not accounting class. Not theory. Just a practical way to read financial reports so you can make better calls on hiring, pricing, spending, debt, and growth.
Your Financials Are Telling a Story Can You Read It
Most business owners I talk to don't ignore their numbers because they don't care. They ignore them because the reports feel disconnected from daily decisions.
You're looking at revenue, expenses, receivables, loan balances, payroll, and cash in the bank. But what you really want to know is simpler. Are we healthy? Are we improving? What needs attention now?
Why the reports feel harder than they should
Part of the frustration is that each statement answers a different question.
One shows what the business owns and owes right now. Another shows whether the business made money over a period. Another shows where the cash went. If you read only one, you get part of the picture, not the whole picture.
That's why owners often say things like:
- “We were profitable, so why was cash tight?” Profit and cash aren't the same thing.
- “Sales were up, so why are we stressed?” Growth can create pressure if collections, inventory, or labor costs get ahead of you.
- “The balance looks okay, but I still feel uneasy.” A decent snapshot can hide weak movement underneath.
Financial reports work like a dashboard. One gauge matters. Several gauges together tell you whether the engine is healthy.
What a useful reading looks like
A useful reading of financials doesn't stop at definitions. It asks business questions.
| What you see | What you should ask |
|---|---|
| Revenue increased | Did margin improve too, or did we buy growth? |
| Net income looks solid | Did cash from operations support it? |
| Cash dropped | Was that from normal operations, equipment spending, or debt payments? |
| Receivables increased | Are customers paying slower, or did billing simply rise with sales? |
That's the shift. You stop reading reports like forms and start reading them like signals.
If you want to learn how to read financial reports well, think like an operator, not just an accountant. Ask what changed, why it changed, and what decision it should drive next.
The Balance Sheet A Snapshot of Your Business Health
You sit down on Monday morning, open the latest balance sheet, and see a healthy asset total. Good sign, maybe. Then you notice cash is thin, receivables are climbing, and a loan payment is due next week. The balance sheet is where that tension shows up first.
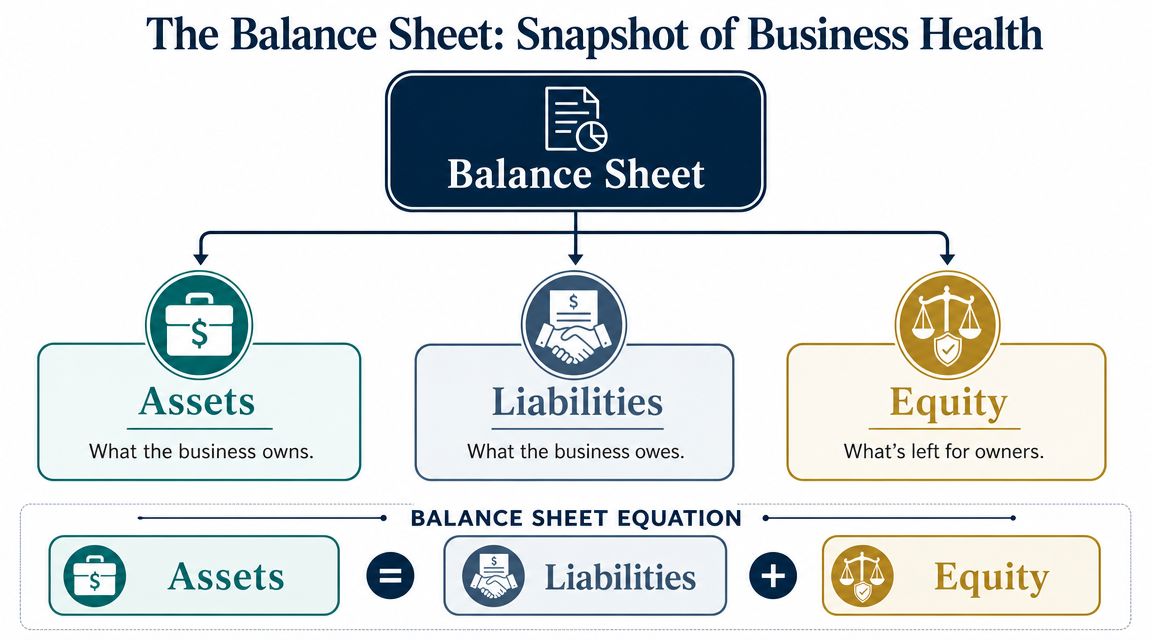
It gives you a date-specific view of what the business owns, what it owes, and what is left for the owners. I use it to answer a practical question: how much room does this business really have to operate, absorb surprises, and fund the next decision?
Start with what is usable, not just what is listed
The basic equation is simple:
Assets = Liabilities + Equity
That matters, but the true value is in the quality of those assets and the weight of those liabilities.
Cash is usable. Old receivables are only usable if customers pay. Equipment can support growth, or it can sit underused while the loan still gets drafted every month. Equity can look solid on paper and still leave you with very little flexibility if too much of the business is tied up in slow assets.
That is why a balance sheet is more than a net worth statement. It is a pressure test.
Where owners should look first
Start with the lines that affect short-term control.
For many service businesses, that means cash, receivables, payables, credit lines, and payroll-related obligations. For contractors or product-based companies, inventory and equipment usually deserve a harder look because they can tie up money fast. In clinics and other insurance-heavy businesses, receivables often carry the whole story of whether reported performance is turning into actual cash.
A quick scan should answer these questions:
- Cash: How many normal bumps can you absorb without scrambling?
- Accounts receivable: Are these recent invoices, or are you carrying slow payers?
- Current liabilities: What has to be paid soon, whether or not customers have paid you yet?
- Long-term debt: Does this support productive growth, or is it reducing future options?
- Equity: Are owners building value, or just plugging recurring gaps?
Practical rule: If receivables rise faster than cash, treat it as a collection question until proven otherwise.
A balance sheet can look fine and still hide stress
This is the mistake I see often. Owners focus on total assets and stop there.
A business can post a respectable current asset balance while struggling to make payroll on time. Why? Because the assets are trapped in overdue receivables, slow inventory, or equipment that cannot be turned into cash without pain. On the other side, debt may look manageable in total, but the payment schedule can still squeeze the business if margins are thin or collections are uneven.
So the better question is not "Are assets up?" It is "Which assets are helping us right now, and which ones are just taking up space?"
| Balance sheet item | Healthy sign | Caution sign |
|---|---|---|
| Cash | Covers normal timing gaps and routine surprises | Frequent juggling between deposits and due dates |
| Receivables | Mostly current and collected on a normal cycle | Aging balances that keep getting extended |
| Inventory or equipment | Directly supports sales and delivery | Slow-moving items or underused assets financed with debt |
| Debt | Tied to a clear plan and affordable payments | Used repeatedly to cover operating shortfalls |
The payoff from reading the balance sheet well is not academic. It helps you decide whether to hire, borrow, delay equipment purchases, tighten collections, or leave owner distributions in the business for another quarter.
If you want a plain-English companion on interpreting business financial statements, that resource gives a helpful legal and practical framing. For a more hands-on breakdown, this guide on how to read a balance sheet for small business reporting is useful if you want examples tied to day-to-day operations.
The Income Statement Are You Actually Making Money
The income statement, also called the profit and loss statement or P&L, shows performance over time.
If the balance sheet is a photo, the income statement is more like a movie. It shows what came in, what went out, and what was left over during the period.

Follow the money from top to bottom
Start at the top with revenue. That's the money earned from your main business activity.
Then work downward. You subtract the direct costs of delivering that work to get gross profit. After that, you subtract operating expenses like payroll, rent, software, insurance, and admin costs. What remains tells you whether the business model is working.
A small clinic is a good example. Revenue comes from patient visits and related services. Direct costs may include clinical labor and medical supplies tied to care. Then come the overhead costs of keeping the practice running, such as admin staff, occupancy, systems, and management.
The checkpoints that matter
You don't need to memorize every line. Focus on the checkpoints.
- Revenue asks, “Are we selling enough?”
- Gross profit asks, “Are the core services or products priced well enough to cover delivery costs?”
- Operating income asks, “Does the business still work after normal overhead?”
- Net income asks, “After everything, did we make money?”
The middle of the statement is where a lot of owners find the actual story. Revenue may be climbing, but if direct labor or delivery costs rise too fast, gross profit gets squeezed. Or gross profit may be solid, but overhead can slowly eat the gains.
If revenue grows and you feel busier but not better, the answer is usually hiding somewhere between gross profit and operating expense.
What works and what doesn't
What works is comparing one period to another and asking what changed in the business.
What doesn't work is staring at a single month in isolation and trying to draw big conclusions from it. A single period can be noisy. Timing, seasonality, and unusual expenses can blur the picture.
The more useful habit is to ask:
- Did revenue growth improve profit, or just create more work?
- Did direct costs stay in line with pricing?
- Did overhead rise for a good reason, like capacity building, or did it just drift upward?
A report that helps owners answer those questions matters more than a report with lots of detail and no interpretation. If you want a practical reference, this walkthrough on how to read an income statement can help you train your eye on the lines that move decisions.
The Cash Flow Statement Following the Money
This is the report owners skip most often, and it's usually the one they need most.
A business can show profit on the income statement and still struggle to pay bills on time. That's because profit is based on accounting rules. Cash flow shows what moved in and out.

Think of it like your business checking account
The cash flow statement tracks movement through three buckets.
Operating activities cover the cash generated or used by the normal business.
Investing activities cover things like equipment, property, or other long-term purchases.
Financing activities cover loans, owner contributions, and debt repayments.
That structure helps answer one of the most useful questions in finance: Where did the cash go?
The three sections in plain English
Here's the plain version.
| Cash flow section | What it usually means |
|---|---|
| Operating | Cash created by doing the work of the business |
| Investing | Cash spent on assets meant to help future operations |
| Financing | Cash coming from or going back to lenders and owners |
Significantly, the same cash decline can mean very different things.
If cash dropped because you bought productive equipment, that may be reasonable. If cash dropped because customers are paying late and operations aren't generating enough on their own, that's a different conversation. If cash only looks okay because of repeated borrowing, that's another one.
Why profitable businesses still feel broke
The usual culprit is timing.
You book revenue when work is done or invoices go out, but cash may come later. Meanwhile, payroll, rent, vendor payments, taxes, and debt service don't wait. A growing business can burn cash because it has to fund the gap between doing the work and getting paid.
That's why accounts payable and collections matter so much. If your payables process is messy, your cash picture gets messy too. If you're building or restructuring that function, this hiring guide for accounts payable is a helpful way to think about the skills needed to keep cash movement under control.
Strong sales don't pay bills. Collected cash does.
When you're learning how to read financial reports, the cash flow statement is where wishful thinking usually ends. It forces the business to show whether operations are funding the company, or whether the company is being propped up by delays, debt, or owner cash.
Connecting the Dots with Key Ratios and Red Flags
You close the month with solid profit, but the checking account feels tight and the line of credit is doing more work than you expected.
That gap is usually where the underlying story starts.
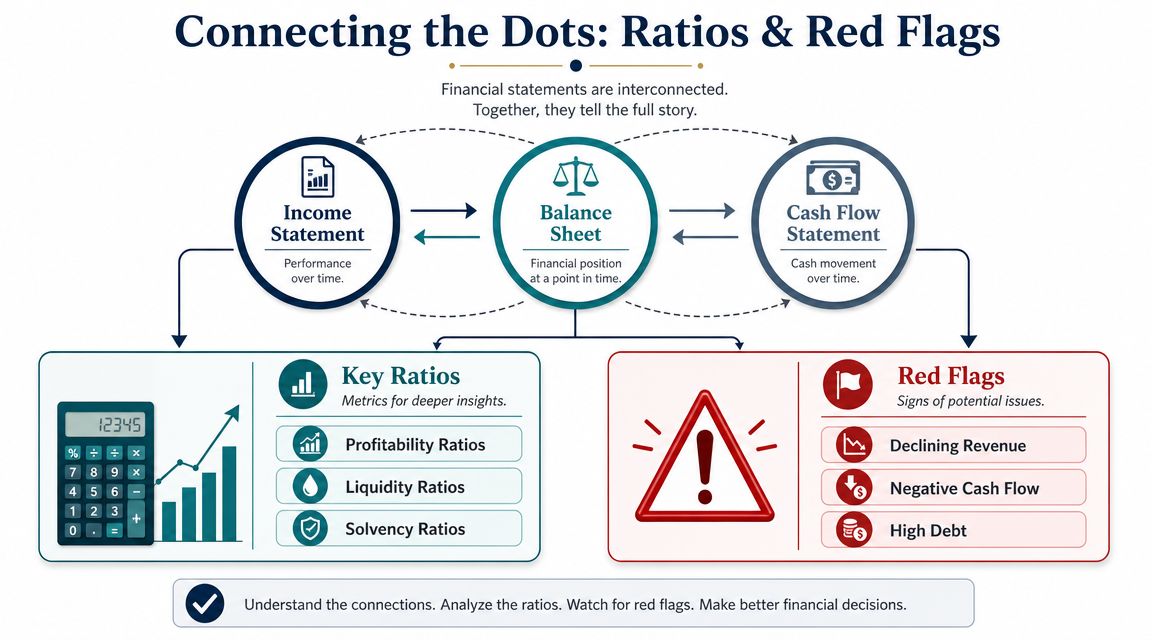
A useful review does not treat the balance sheet, income statement, and cash flow statement as separate homework assignments. Read them together. A sale on credit can lift revenue on the income statement, increase receivables on the balance sheet, and leave cash unchanged. If you only look at profit, you can miss the pressure building underneath.
One business event leaves tracks in all three reports
Take a simple example. You land a large job, send the invoice, and book the revenue.
On paper, the month looks stronger. Revenue and profit improve. Receivables rise. Cash may not move for 30, 60, or 90 days. For an owner making payroll and deciding whether to hire, those are very different realities.
That is why ratio review matters. It helps translate the three reports into operating questions: Are customers paying on time? Are margins holding up? Is debt covering a temporary gap or a recurring weakness?
Ratios worth checking every period
A good ratio review is not about collecting formulas. It is about spotting changes early and deciding whether they are normal, temporary, or signs of a bigger issue. Santa Clara University's guidance on financial statement analysis is useful here because it focuses on a short list of ratios and trend comparisons, not one-off snapshots in this financial statement analysis guide.
Focus on these:
- Current ratio. Can the business cover near-term obligations with near-term assets?
- Quick ratio. Same question, but with a tougher standard that strips out less liquid current assets.
- Gross margin. After direct costs, how much room is left to cover overhead and produce profit?
- Operating margin. Is the core business generating enough after payroll, rent, software, and other operating costs?
- Receivables turnover. Are invoices turning into cash at a healthy pace, or are collections drifting?
- Debt-to-equity. How much of the business is being financed by lenders versus the owners?
Used well, ratios save time. Used poorly, they give false comfort.
A strong current ratio can still hide slow-moving inventory or old receivables. Healthy margins can sit next to weak cash generation if too much cash is tied up in working capital. If you want a clearer framework for reading those patterns, this financial statement analysis resource from MyOfficeOps lays out the connection between liquidity, efficiency, and profitability in practical terms.
Red flags that deserve a second look
Owners do not need a forensic accounting background to catch problems early. Start with the mismatches.
- Profit is rising while operating cash flow is weakening. Collections, inventory, or prepaid spending may be eating the gain.
- Receivables are growing faster than sales. Customers may be paying later, billing may be sloppy, or some revenue may be less collectible than it looks.
- Debt keeps increasing but equity is not improving much. The business may be relying on borrowing to support day-to-day operations.
- Margins look steady but cash keeps disappearing. The issue often sits in timing, working capital discipline, or spending that has not yet produced a return.
I also like to compare these signals against an outside-buyer mindset. If you were evaluating your own company for purchase, what would make you pause? Bizbe's 2026 due diligence guide is a good reference because it shows the kinds of inconsistencies a buyer will probe when the reports do not line up.
The payoff here is simple. Ratios help, but true value comes from noticing when the three reports are telling different parts of the same story. That is usually where the next good decision is hiding.
Turn Your Financial Reports into a Roadmap for Growth
Once you know how to read financial reports, the next move is to use them to make decisions faster and with less guesswork.
That means moving past a backward-looking review. Workday's guidance makes this point well: true value comes from reading results across time and against peers, then asking what changed, whether it's temporary or structural, and what action it should drive in pricing, hiring, or capital spending in Workday's discussion of reading financial reports.
Turn numbers into operating decisions
A good review meeting shouldn't end with “looks okay.”
It should lead to decisions like these:
- Pricing: Are margins holding, or are you discounting too much to win work?
- Hiring: Is overhead rising because you're building useful capacity, or because roles were added without clear return?
- Capital spending: Will new equipment or software reduce pressure and improve output, or just create another fixed payment?
- Debt policy: Is borrowing supporting growth with a clear payoff, or plugging recurring cash gaps?
That “so what” lens matters even more in a small business, where one hiring decision or one bad collection cycle can ripple through the whole company.
When outside help makes sense
There's a point where DIY review stops being efficient.
If your books are late, your reports don't tie together, or you can't get plain-English answers from the numbers, bring in help. That could be a bookkeeper who cleans up reporting, a CPA who helps with technical issues, or a fractional CFO who connects the statements to planning decisions. One option in that mix is MyOfficeOps, which provides bookkeeping, reporting, financial analysis, and CFO-level advisory for small and midsize businesses.
If you're preparing for financing, a sale, or an investor conversation, your standard monthly review also needs to get sharper. A practical reference point is Bizbe's 2026 due diligence guide, which shows the kind of financial organization buyers and investors typically expect.
The goal isn't to become an accountant. It's to become the kind of owner who can look at the reports and ask the right next question.
If you want help turning your financial reports into clear decisions on cash flow, pricing, hiring, and profitability, MyOfficeOps works with small and midsize businesses to clean up the numbers and make them usable. The result is simple: reports you can understand, and advice you can act on.