So, what is financial statement analysis? Put simply, it’s looking at your business's financial reports to see how it's really doing. Think of it like a doctor giving your business a check-up. It turns a bunch of numbers into a clear story about what's going on inside your company.

Uncovering the Story Behind Your Numbers
Imagine your business's financial statements are like the dashboard in your car. The dashboard shows your speed, how much gas you have, and if the engine is getting too hot. Just looking at one thing—like your sales—is like only watching the speedometer. You might be going fast, but you could be about to run out of gas or have the engine overheat.
Financial statement analysis is when you look at all those dials together. It’s about connecting the dots between your different reports to get the full picture.
Your three main reports—the income statement, balance sheet, and cash flow statement—are where you start. Each one answers a big question about your business.
Your Three Key Financial Health Reports
Here’s a simple way to think about these reports and what they tell you.
| Financial Statement | What It Tells You | Simple Analogy |
|---|---|---|
| Income Statement | "Did we make or lose money over a certain time?" | The scoreboard from last quarter's game. |
| Balance Sheet | "What is our company's net worth right now?" | A picture of your bank account today. |
| Cash Flow Statement | "Where did our cash actually go?" | A video replay of money moving in and out. |
Instead of just seeing you made $50,000 in sales, analysis helps you understand the story behind that number. How much did it cost you to make those sales? Is that more or less than last month? And most importantly, did that money actually show up in your bank account?
This process turns confusing data into a story you can actually use. For a deeper dive into profitability, check out our guide on what is a profit and loss statement.
A Practice Built on Decades of Trust
This isn't some new idea; it’s a proven way to make smart business decisions. The practice became more common in the early 1900s as accounting rules got more consistent. A big moment happened in 1934 when the U.S. government started requiring public companies to share their financial statements. This completely changed how investors could check on a company's health.
The point of financial statement analysis isn't just to do math—it's to ask better questions. It helps you go from asking "What happened?" to "Why did it happen, and what should we do next?"
Ultimately, this process gives you the power to stop guessing and start making choices based on facts. Whether you’re thinking about hiring someone new, buying equipment, or just figuring out if you’re on the right track, understanding your financial story is the most important step. It’s how you take control of your business's future.
Why This Isn't Just for Big Corporations
When you hear “financial statement analysis,” you might picture Wall Street traders staring at complicated charts. But thinking this is only for giant companies is a big mistake that many small business owners make. For a local coffee shop, a landscaping company, or a growing doctor's office, this is your roadmap to success.

This isn't about complicated theories. It’s about getting real answers to the questions that keep you up at night.
- "Can I really afford to hire someone?"
- "Do I have enough cash to get through the slow season?"
- "Should I buy that new piece of equipment, or will it put me in a tough spot?"
Without looking at your financial statements, you’re basically driving blind. You might know how fast you're going (your sales), but you have no idea if you're about to run out of gas or if the engine is smoking. It's the only way to get an honest look under the hood of your business.
From Guesswork to Smart Decisions
Making decisions based on a gut feeling can only take you so far. Financial analysis replaces guesswork with real data, so you can feel confident you're making the right moves.
Imagine you own a small construction company. You feel like business is good because jobs are coming in. But after looking at your statements, you find out your material costs have gone up by 15% in the last six months, while your prices have stayed the same. This one piece of information lets you adjust your quotes before you start losing money on projects.
This is the power of financial statement analysis. It helps you:
- Spot Problems Early: Catch small issues, like rising expenses or customers who pay late, before they become big disasters.
- Find Opportunities: Figure out which of your products or services makes you the most money, so you can focus your energy there.
- Plan for the Future: Create realistic budgets and set goals based on how your business is actually doing, not just wishful thinking.
This isn't just about looking at the past. It's about using the story your numbers tell to write a better future for your company.
Real-World Wins for Local Businesses
The benefits here aren't just ideas; they lead to real results that help your business.
For the small and midsize businesses we work with, this analysis leads to practical wins. For example, looking at five years of data often shows you patterns in your cash flow you'd otherwise miss. We've seen cases where 68% of construction firms improve their job profits by 15-20% just by noticing that their clients tend to pay at certain times of the year. You can learn more about how historical data drives success by exploring these insights on financial statement accuracy.
At the end of the day, analyzing your financials is about more than just numbers on a page. It’s about building a stronger business that can handle surprises and grab opportunities. It’s the difference between hoping for success and actually planning for it.
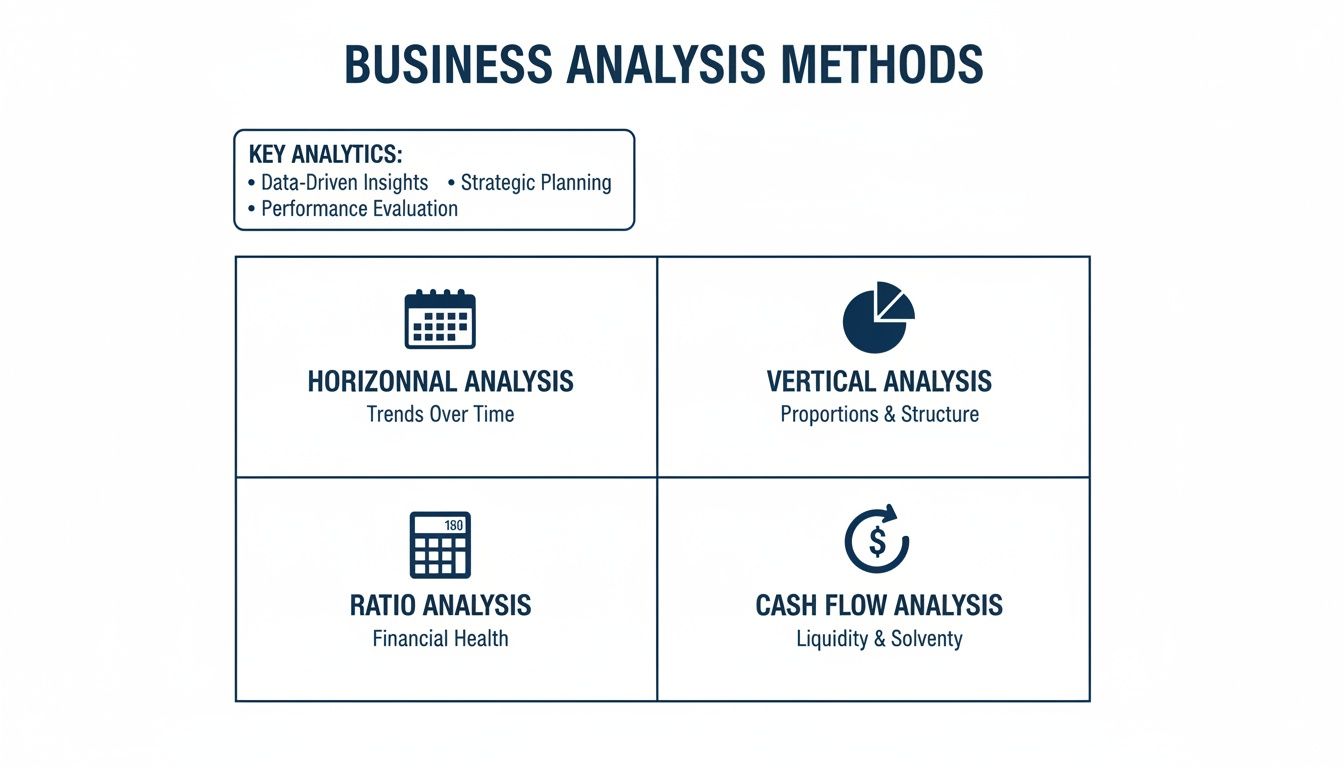
Four Simple Ways to Analyze Your Financials
You don’t need a finance degree to understand your numbers. Think of financial statement analysis like using a few different tools from a toolbox—each one gives you a different way of looking at your business's health. By looking at your company from different angles, you get the whole story.
There are four common-sense methods that anyone can learn. Let’s break them down.
Horizontal Analysis: Looking Back in Time
The first tool is horizontal analysis, and it’s probably the most natural way to look at your numbers. All you’re doing is comparing a number from one period to the same number in an older period.
It’s like looking at a photo of yourself from last year and comparing it to one from today to see what’s changed. Did you get a haircut? It’s the same idea.
For example, you might compare:
- This month's sales to last month's sales.
- Your first-quarter profits this year to your first-quarter profits last year.
- How much you spent on marketing in June versus how much you spent in May.
This method is great for spotting trends. If your sales have gone up 10% every quarter for a year, that's a great trend. But if your costs are slowly going up by 5% each month while your sales are flat, that’s a red flag telling you it's time to figure out why.
Vertical Analysis: Seeing the Big Picture
Next up is vertical analysis. This helps you understand how different parts of your business fit together. Instead of comparing numbers across time, you look at them as a piece of a bigger pie in a single time period.
Think of it like a pizza. Vertical analysis tells you what percentage of the whole pizza each slice is.
The magic of vertical analysis is that it puts every number into perspective. A $1,000 marketing expense means one thing for a business with $5,000 in sales, and something completely different for a business with $100,000 in sales.
For example, on your income statement, you could look at every expense as a percentage of your total sales. This helps you answer questions like:
- What percentage of our sales is eaten up by the cost of the things we sold?
- How much of every dollar we earn goes toward paying rent?
- Is what we're spending on ads a reasonable part of our total sales?
This is really useful for comparing your business to others in your industry, even if they are much bigger or smaller than you.
Ratio Analysis: Getting Quick Answers
The third and most popular tool is ratio analysis. This one sounds a bit more technical, but it’s really just about using simple formulas to get quick answers to important questions about your company’s financial health.
These ratios are like a quick check-up at the doctor. They can tell you if you have enough cash to pay your bills, how much profit you're really making, or how fast your customers are paying you. We'll cover the most important ratios in the next section, but the main idea is that they turn two different numbers from your statements into one useful piece of information.
Cash Flow Analysis: Following the Money
Finally, there’s cash flow analysis. This method is focused on one thing: cash. It ignores things like sales you made but haven't been paid for yet and just looks at the actual money moving into and out of your bank account.
Your cash flow statement is the main report you'll use for this. This is super important because a business can look profitable on paper but still go out of business if it runs out of cash. It answers the most important question of all: do we have enough cash to stay open?
By using these four methods together, you stop just looking at numbers and start understanding the story they tell. Each one gives you a different clue, helping you make smarter, more confident decisions.
Key Financial Ratios Every Business Owner Should Watch
Let’s be honest, the term "ratio analysis" sounds scary. It might bring back memories of high school math class. But really, it’s just using simple division to get quick, powerful answers about your business's health.
You don’t need to track dozens of them. Focusing on a few key financial ratios can tell you almost everything you need to know.
Think of these ratios as your business's vital signs. A doctor doesn't run a hundred tests for a regular check-up; they look at your blood pressure, heart rate, and temperature. These ratios do the same for your company, giving you a fast, clear look at how it’s doing.
We’ll focus on the big three questions ratios can answer: can you pay your bills, are you making money, and are you using your stuff wisely?
Each of these methods—from horizontal to cash flow analysis—gives you a different lens to see the complete story behind your numbers.
Can You Pay Your Bills This Month?
The first question that keeps every business owner up at night is, "Do we have enough cash to pay our bills?" Liquidity ratios give you the answer, plain and simple.
The most important one to watch is the Current Ratio.
It’s calculated by dividing your current assets (cash and things you can turn into cash within a year) by your current liabilities (bills you have to pay within a year).
- Formula: Current Assets / Current Liabilities
- What It Means: For every dollar you owe soon, how many dollars in assets do you have ready to pay for it?
- A Good Number: A ratio of 2:1 or higher is usually considered healthy. It means you have two dollars ready for every one dollar of short-term bills. A ratio below 1:1 is a big red flag, suggesting you might have trouble paying your employees or suppliers on time.
For example, if a small marketing agency has $50,000 in assets and $25,000 in liabilities, its current ratio is 2.0. This shows they are in a good spot to handle their bills.
How Much Profit Do You Actually Keep?
Sales are nice, but profit is what keeps the lights on. Profitability ratios tell you how good your business is at turning sales into actual profit.
The Net Profit Margin is a great way to check your company's overall financial health.
This ratio shows you what percentage of every sale is left over after all expenses—including taxes—have been paid. It’s the real bottom line.
- Formula: (Net Income / Revenue) x 100
- What It Means: For every dollar in sales, how many cents do you get to keep as pure profit?
- A Good Number: This changes a lot depending on your industry, but a 10% net profit margin is often seen as average, while 20% is very good.
Imagine a local coffee shop made $100,000 in sales and had a net income of $8,000. Its net profit margin would be 8%. This tells the owner that for every dollar of coffee sold, they keep eight cents.
How Well Are You Using Your Resources?
Finally, efficiency ratios show how well you're using your assets. Are you selling your products quickly? Are you getting paid by customers on time?
A key efficiency number is the Accounts Receivable Turnover ratio.
This ratio measures how quickly your business collects the money it's owed by customers. In simple terms, it tells you how fast your clients are paying their bills.
- Formula: Net Credit Sales / Average Accounts Receivable
- What It Means: A high number is good—it means you collect cash from customers quickly. A low number suggests you might have a problem with your collections, which can hurt your cash flow.
- A Good Number: This really depends on your industry and payment terms. The key is to watch the trend. If it's getting slower, it's time to find out why.
For instance, a landscaping company with slow-paying clients will have a low turnover ratio, which ties up cash it needs for gas and equipment. By improving its invoicing and follow-up, it can increase its turnover and free up that cash.
If you want to dive deeper into this metric, you can learn more about what is accounts receivable turnover in our detailed guide.
Here's a quick cheat sheet to help you keep these ratios straight.
Essential Financial Ratios at a Glance
This table breaks down the most important financial ratios every small business owner should know. Think of it as your quick-reference guide to understanding the story your numbers are telling.
| Ratio Name | What It Measures | Why It's Important |
|---|---|---|
| Current Ratio | Your ability to pay your short-term bills with your short-term assets. | It tells you if you can pay your immediate bills, like payroll and rent, without stress. A low ratio is a big red flag for cash flow problems. |
| Net Profit Margin | The percentage of sales left after all expenses are paid. | This shows your company's true profitability. A healthy margin means your business model is sound and you're pricing things right. |
| Accounts Receivable Turnover | How quickly you collect cash from customers who pay you later. | A high turnover means cash is flowing into your business quickly. A low turnover signals potential problems with getting paid. |
| Debt-to-Equity Ratio | How much of your business is paid for by debt versus your own money. | It shows your company's financial risk. Lenders watch this closely; a high ratio can make it hard to get a loan. |
| Return on Assets (ROA) | How well you use your assets to make a profit. | It answers the question: "How good are we at making money with the stuff we own?" A higher ROA means you're managing things well. |
Keeping an eye on these key numbers moves you from just running your business to leading it. They help you make smart, data-driven decisions that lead to real growth.
How to Do Your First Financial Analysis
Ready to jump in? Your first financial analysis is much simpler than it sounds. You don’t need an accounting degree or fancy software—just a clear plan and the right questions. We’ll walk through it together with a simple, five-step process.
Let's use a real-world example everyone can understand: a neighborhood shop called "Sweet Treats Bakery."
Step 1: Gather Your Reports
First, you need your raw materials. Pull up your three main financial statements for a specific time period, like the last quarter or the past year.
- Income Statement (your profit and loss)
- Balance Sheet (what you own and what you owe)
- Cash Flow Statement (where your cash went)
For our bakery, the owner, Maria, prints out these three reports from her accounting software for the last quarter. That's it.
Step 2: Ask a Clear Question
Don't try to analyze everything at once—that will just be overwhelming. Instead, pick one or two specific questions you want answered. This keeps you focused and makes the process actually useful.
Good questions to start with might be:
- Are we making enough profit?
- Is our cash flow getting better or worse?
- Can we easily pay our bills next month?
Maria’s biggest worry right now is profitability. So, she asks one simple question: "Is my profit margin getting smaller?"
Step 3: Pick the Right Tool for the Job
Now, you choose the analysis method that best answers your question. Since Maria wants to compare her profitability over time, Horizontal Analysis is a great place to start. She'll also use a bit of Ratio Analysis—specifically, the net profit margin—to get a clear percentage she can compare.
This is the whole point of financial analysis: picking the right tool to answer the right question.
Step 4: Do the Simple Math
This is where the numbers start telling their story. Maria pulls up her Income Statements for the last two quarters.
- Last Quarter: She had $50,000 in sales and a net profit of $5,000.
- This Quarter: She had $55,000 in sales and a net profit of $4,400.
Next, she calculates her Net Profit Margin for both periods. The formula is just Net Profit / Total Sales.
- Last Quarter's Margin: ($5,000 / $50,000) = 10%
- This Quarter's Margin: ($4,400 / $55,000) = 8%
The numbers have answered her question. Yes, her profit margin is shrinking.
Step 5: Ask the Most Important Question: "So What?"
Getting a number isn't the finish line. The most important step is asking, "So what does this mean, and what am I going to do about it?" This is where you turn information into action.
The goal of analysis isn't just to find an answer, but to make a better decision. The numbers tell you what happened; your job is to figure out why and what's next.
Maria sees her sales went up, but her actual profit went down. That smaller margin tells her one thing for sure: her costs are growing faster than her sales.
Now she can start digging deeper. Did the price of flour and butter go up? Did she hire a new baker and increase her payroll?
After a little investigating, she finds out her main ingredient supplier raised prices by 15% at the start of the quarter. With that information, her next move is clear. She can now look for a new supplier, raise the prices of her cakes, or find ways to reduce waste in the kitchen to protect her profit.
How This Simple Habit Increases Your Business Value
Analyzing your finances isn’t just about paying today's bills; it’s about building a more valuable company for tomorrow. Think of it this way: when you eventually want to get a loan, bring on a partner, or sell your business, people aren't just buying your product. They're buying your financial story.

A business with a history of clean, well-analyzed financial statements is seen as less risky and more professional. It proves you know what makes your business work and aren’t just getting lucky. Good trends in your key numbers provide proof of a healthy, growing company—one that someone would be happy to invest in.
Turning Numbers Into Dollars
When a potential buyer looks at your company, they see organized financials as a sign of a well-run business. This simple habit of financial statement analysis can directly lead to a higher price tag for your company.
The data backs this up. Looking at historical financials has been shown to boost a business's value by 22-35% for owners getting ready to sell. On top of that, data from business sales between 2015 and 2024 shows that companies with clean, well-documented financials sold for 28% more. Understanding these trends is a key part of business exit planning strategies that help you get the most value.
This work isn't just an exercise; it’s one of the best ways you can spend your time. It’s how you go from just having a job to building a truly valuable asset.
Building a Sellable Business Today
You don’t have to wait until you’re ready to sell to see the benefits. Consistently looking at your finances makes your business stronger and more profitable right now. This process helps you find real strategies to improve profit margins, which adds to your business's value year after year.
Think of it like taking care of a classic car. A car with a complete service history, showing every oil change and tune-up, is worth far more than one with a mysterious past. Your financial records are your business's service history.
By regularly doing this analysis, you create a track record of stability and growth. You can prove you're profitable, show you have control over your cash, and point to a clear upward trend. When it's time to figure out what your business is worth, you're not just showing one picture; you're presenting a whole story of success, backed by years of clear data.
Got Questions About Financial Analysis? We’ve Got Answers.
Jumping into your finances for the first time always brings up questions. It’s normal to wonder if you’re doing it right or where to even start. Here are some simple answers to the questions we hear most often from business owners just like you.
How Often Should I Actually Be Doing This?
For most small businesses, looking at your financials every month is a game-changer. Think of it as a quick health check-up for your company. This monthly habit lets you spot small things—like a sudden jump in expenses—before they turn into big problems.
At the very least, plan on doing a deeper dive every quarter. This is your chance to zoom out and look at the bigger picture and trends over time. The most important thing is to be consistent. When you look at your numbers regularly, you start to get a feel for the natural rhythm of your business.
What Are the Biggest Mistakes People Make?
It’s easy to fall into a few common traps, especially when you're new to this. If you can avoid these, your analysis will be much more helpful.
- Tunnel Vision: The biggest mistake is focusing on one number, like total sales, while ignoring everything else. I've seen businesses with great sales go under because their costs were out of control. You have to look at the whole picture.
- Forgetting the Past: Another big one is looking at a number all by itself. Is $10,000 in profit good? You have no idea until you compare it to last month, last quarter, or the same time last year. You need to compare it to something.
- Stopping Too Soon: Finally, don’t just calculate a ratio and stop there. The real magic happens when you ask, "So what?" and decide what you’re going to do next based on what the numbers are telling you.
Do I Need Some Fancy, Expensive Software for This?
Absolutely not. You can get started right now with a basic spreadsheet. As your business grows, accounting software like QuickBooks or Xero will definitely make your life easier by creating these reports for you automatically.
The goal isn't to have the fanciest tool; it's to build the habit of looking at your numbers and understanding the story they tell.
For business owners who want an expert to help them read between the lines and build a clear plan for growth, working with a firm can provide the clarity and confidence you need to move forward.
Financial analysis is a powerful habit that moves you from reacting to problems to actively building the future you want. If you're ready for an expert partner to provide clarity and guide your financial decisions, MyOfficeOps is here to help. Schedule a discovery call with us today.