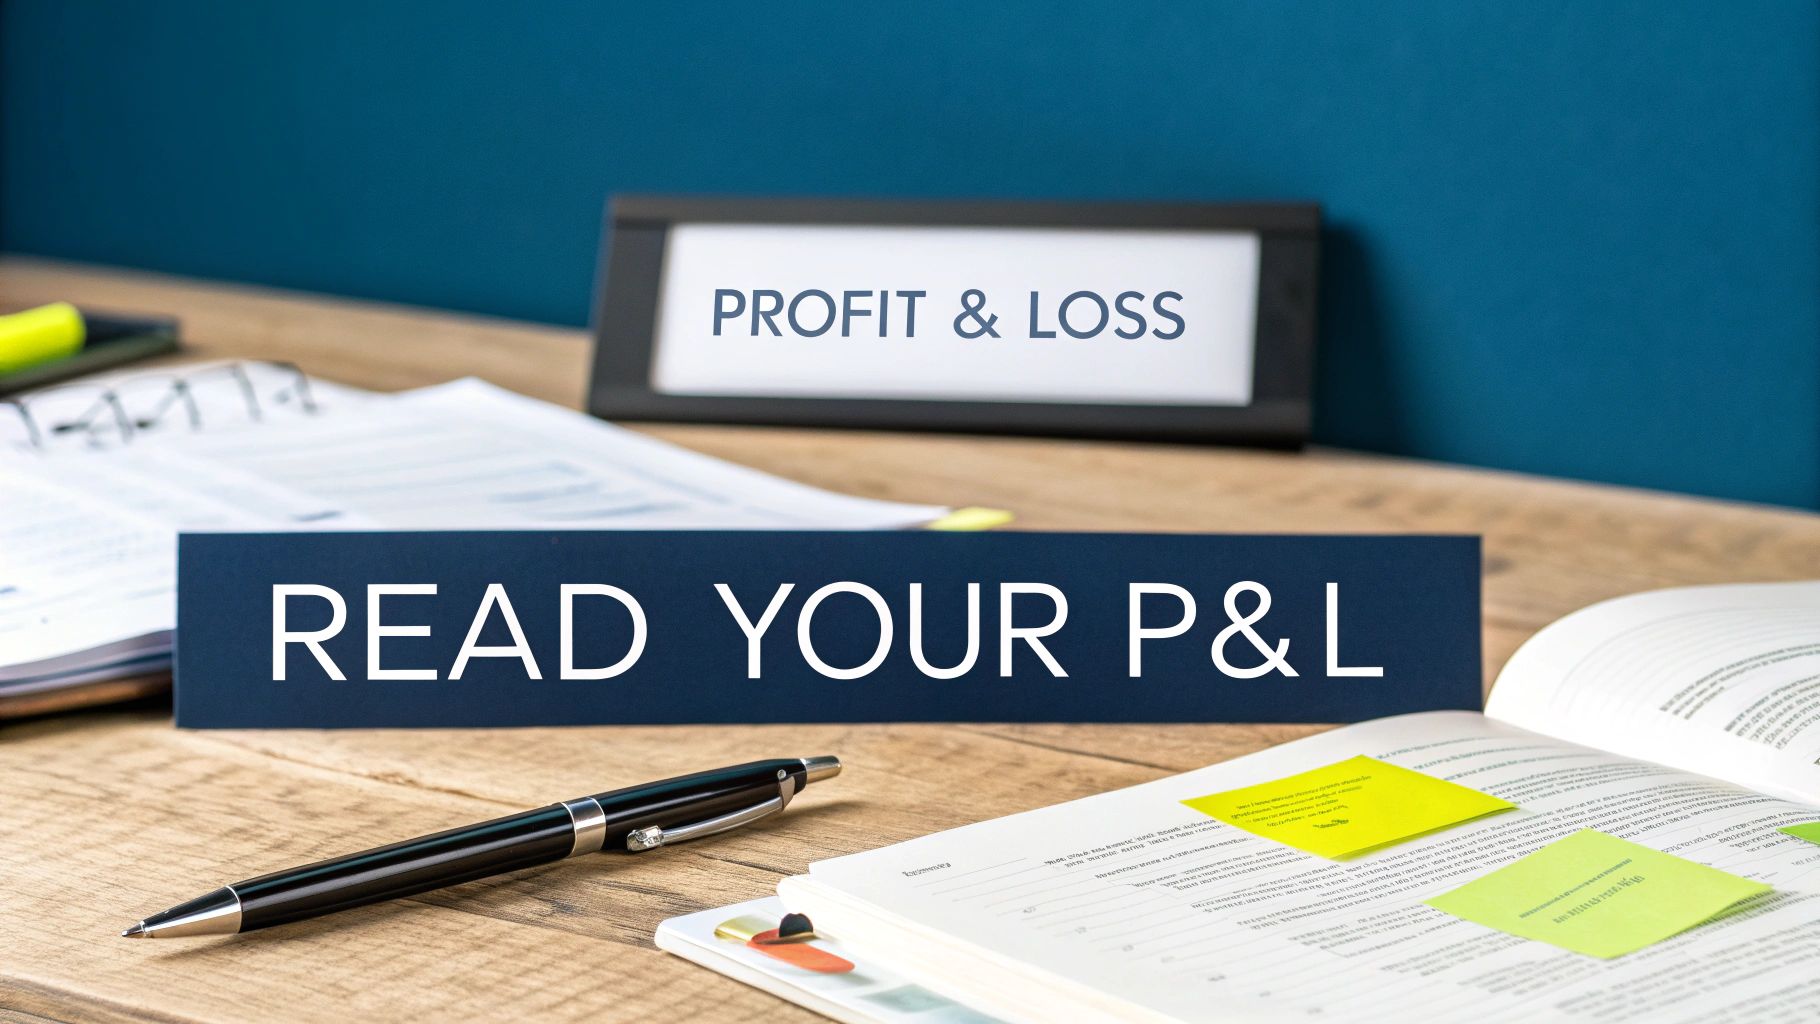
As a business owner its important to really understand what is a profit and loss statement. Think of your business’s Profit and Loss (P&L) statement as its report card. At the end of the month, quarter, or year, it answers one simple question: Did you make money or lose money?
Your Business Report Card, Explained
Ever had a lemonade stand? You probably did some quick math in your head: you sold $20 worth of lemonade and spent $5 on lemons and sugar, so you made a $15 profit.
That’s a P&L statement. It sounds fancy, but it’s just the story of how your business did, written down in a clear, organized way.
The P&L, also called an income statement, lists all the money you earned (revenue) and subtracts all the money you spent (expenses) over a certain time. The final number at the bottom—your net profit or net loss—is your final grade. It tells you if your business is actually making money.
Why This Report Card Matters So Much
Just handing your P&L to your accountant without looking at it is a huge mistake. It’s one of the best tools you have for making smart decisions. When you start looking at it regularly, you stop guessing about how your business is doing and you start knowing.
It’s not just a gut feeling. A study showed that 82% of small business owners who check their P&L regularly feel they make better financial decisions. You can learn more about this in this detailed guide from Valueworks.ai.
What the P&L Story Tells You
So, what kind of story does it tell? The P&L answers the biggest questions you have about your business:
- Are we selling more stuff? You can easily see if your sales are going up or down over time.
- Where is all the money going? It lists every expense, showing you if you’re spending too much on ads, supplies, or rent.
- Is my price right? By comparing what you sell to what it costs to make it, you can see if you’re charging enough to stay in business.
- Can I hire someone? It shows you exactly what’s left after all the bills are paid, so you know what you can really afford.
A Profit and Loss statement isn’t just about the past. It gives you the information you need to build a better future. It turns confusing numbers into a simple map for your business.
A P&L takes the mystery out of your finances. Instead of just hoping you’re making a profit, you get the facts. This simple document helps you understand how you’re doing, spot problems early, and guide your company toward growth.
The Building Blocks of a P&L Statement
If a P&L is your business’s report card, let’s see how the final grade is calculated. Think of it like a story. It starts at the top with every dollar you earn and subtracts all your costs along the way until you get to the final number. Each line is an important part of that story.
To make it easy, we’ll use a simple coffee shop as our example.
Revenue: The Top of the Stack
The story starts with Revenue. This is the first line on your P&L. It’s all the money your business brings in from sales before you take out any expenses.
For our coffee shop, this is every dollar from every latte, muffin, and bag of beans sold. If the shop sold $10,000 worth of coffee and pastries in a month, its revenue is $10,000. That’s where we begin.
This simple chart shows how revenue, expenses, and profit stack up to tell your financial story.
As you can see, profit isn’t just the money that comes in; it’s what’s left after you subtract all your costs.
Cost of Goods Sold: What It Costs to Make Your Stuff
Right under revenue, we subtract the Cost of Goods Sold (COGS). These are the direct costs of making the products you sell. If you didn’t sell anything, you wouldn’t have these costs.
For the coffee shop, COGS includes:
- The cost of coffee beans
- The milk and sugar
- The flour and chocolate for the muffins
- The paper cups and lids
Let’s say those direct costs were $3,000 for the month. We subtract this from our revenue.
Gross Profit: Your First Hint of Success
When you subtract COGS from Revenue, you get your Gross Profit. This is a big one. It tells you how much money you made from your product before paying for everything else, like rent and salaries. It’s the first check to see if your prices are right.
- Formula: Revenue – COGS = Gross Profit
- Our Example: $10,000 (Revenue) – $3,000 (COGS) = $7,000 (Gross Profit)
This means the coffee shop made $7,000 just from selling stuff, after paying for the ingredients. Now, let’s see what it costs to keep the shop running.
Operating Expenses: The Cost of Keeping the Lights On
Next up are Operating Expenses (OpEx). These are all the costs to run the business that aren’t directly tied to making one product. Think of them as overhead—the bills you have to pay no matter how many coffees you sell.
Common operating expenses include:
- Rent for the shop
- Employee salaries
- Marketing like social media ads
- Utilities like electricity and water
- Insurance
Let’s say the coffee shop’s operating expenses for the month add up to $4,000. Keeping these costs organized is a key part of good bookkeeping. If you’re new to this, checking out some basic bookkeeping tips for business owners can really help.
What About EBITDA?
You might hear the term EBITDA. It stands for Earnings Before Interest, Taxes, Depreciation, and Amortization. Basically, it’s a way to look at your operating profit before some other expenses are counted. Investors sometimes use it to compare companies, but for now, just know it’s another way to measure profit that’s between Gross Profit and Net Profit.
Net Profit: The Bottom Line
Finally, we get to the most famous part of the P&L: the “bottom line,” or Net Profit. This is what’s left after every single expense has been paid. It’s the true measure of whether you made money.
To find it, we subtract our operating expenses from our gross profit.
- Formula: Gross Profit – Operating Expenses = Net Profit
- Our Example: $7,000 (Gross Profit) – $4,000 (OpEx) = $3,000 (Net Profit)
So, after paying for beans, milk, rent, and staff, the coffee shop owner has $3,000 left over. That’s the real profit. This final number tells the story: the business made money. If that number was negative, it would be a net loss, which is a sign that it’s time to make some changes.
How to Read the Story Your P&L Tells
Getting your P&L statement is the first step, but the real magic is learning how to read it. It’s not a math test. It’s a storybook for your business. Every number tells you something—what’s going on, where you’re winning, and where you might be losing money.
Reading this story isn’t for financial wizards. It’s just about asking simple questions and knowing where to find the answers on the page. The goal is to turn that piece of paper into a tool that helps you make smarter decisions every day.
Spotting Trends The Simple Way
The first thing I tell every business owner is to stop looking at just one month. Lay out your P&Ls for the last few months side-by-side. This is the fastest way to see which way your business is really going. You don’t need fancy formulas, just your eyes.
Start by asking these questions:
- Is my revenue actually going up? Hopefully, you see it climbing. But if it’s flat or jumping around, it’s time to look at your sales and marketing.
- Are my costs getting higher? It’s normal for costs to go up as you grow, but are they growing faster than your sales? That’s a big warning sign. If you see a sudden jump in a cost like “Software,” you need to find out why.
- How does this March compare to last March? This is important for seasonal businesses. If you own an ice cream shop, of course sales are lower in December. But comparing this December to last December tells you if you’re still on track.
Measuring Your Health with Two Key Numbers
Besides just spotting trends, you can use two simple percentages to understand your P&L’s story even better. These are quick health checks for your business: Gross Profit Margin and Net Profit Margin.
Let’s use a pretend online t-shirt business, “ThreadsCo,” to make this real.
Gross Profit Margin tells you how much profit you make from selling each t-shirt before you pay for things like rent, salaries, or marketing. It’s the best way to see if your product itself is profitable.
Imagine ThreadsCo had $10,000 in sales last month. The direct cost of the shirts and printing (their COGS) was $4,000. This leaves them with a Gross Profit of $6,000.
To get the margin, just divide the Gross Profit by the Revenue: $6,000 / $10,000 = 0.60. This means ThreadsCo has a 60% Gross Profit Margin. For every dollar they make in sales, they have 60 cents left to cover all their other business expenses.
Net Profit Margin is the real bottom line. It’s the percentage of your total sales that you actually get to keep as profit after every single bill has been paid.
After ThreadsCo paid for its website, Facebook ads, and salaries, let’s say their total expenses came to $8,500. Their Net Profit is what’s left: $1,500 ($10,000 Revenue – $8,500 Total Expenses).
To find this margin, you divide the Net Profit by the Revenue: $1,500 / $10,000 = 0.15. This gives ThreadsCo a 15% Net Profit Margin. When all is said and done, the business keeps 15 cents of every dollar it brings in.
Turning Numbers into Questions
Knowing these margins helps you ask the right questions. If ThreadsCo’s Gross Profit Margin suddenly drops from 60% to 50%, the owner should ask: “Did the price of my blank shirts go up? Did my printer charge me more?”
But if the Net Profit Margin shrinks while the Gross Margin is fine, the question changes: “Did I spend way too much on marketing this month? Did my software costs go up?”
These insights are gold. They tell you exactly where to look to fix a problem or do more of what’s working. Getting comfortable with these numbers is the first step when you’re ready to really know your numbers and take control of your company’s finances.
P&L vs Balance Sheet vs Cash Flow
It’s easy to get the three main financial reports mixed up. They all deal with money, right? But each one tells a completely different—and equally important—story about your business. Understanding their jobs is key to knowing your company’s financial health.
Think of it this way: if your business were a car on a road trip, each report would be a different gauge on the dashboard.
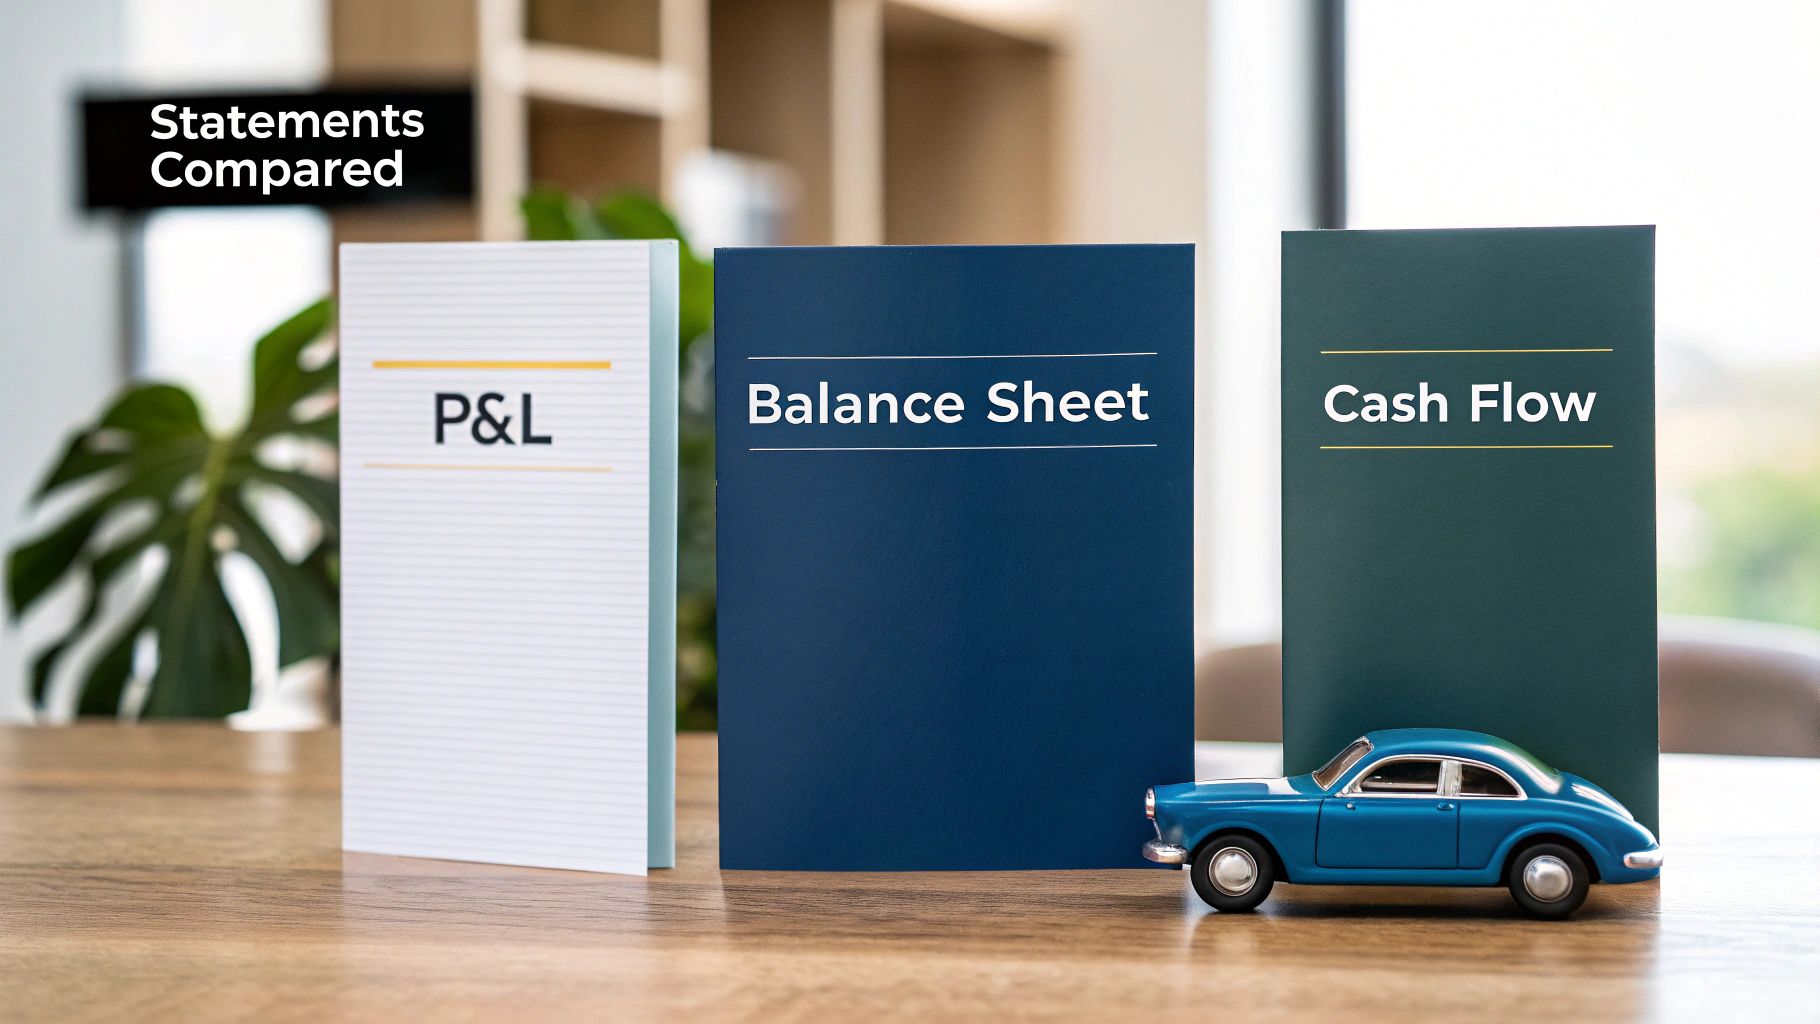
- The Profit and Loss (P&L) Statement is your speedometer. It tells you how fast you were going over a period of time—your results for last month or last year.
- The Balance Sheet is like a photo of your car. It’s a snapshot on one specific day, showing what the car is made of (what you own) and who has a claim to it (what you owe).
- The Cash Flow Statement is your fuel gauge. It tracks the actual gas moving into and out of your tank. It doesn’t care about your speed, just how much fuel you have to keep running.
This simple idea shows the main difference: a P&L measures performance over time, while the others have different jobs.
The Big Difference Between Profit and Cash
Here’s a huge trap for new business owners: thinking that profit on the P&L is the same as cash in the bank. It’s not, and this mistake can be dangerous. I’ve seen businesses that look great on paper go out of business because they ran out of money.
How does that happen? It’s all about timing.
Let’s say you own a small marketing company. You finish a big $20,000 project in March. Your P&L for March will show that $20,000 as revenue, making it look like a great month. But what if your client has 60 days to pay you?
Even though your P&L looks amazing, the cash won’t actually be in your bank account until May. In the meantime, you still have to pay rent and salaries in March and April. Your P&L says you’re profitable, but your cash flow statement shows money going out with nothing coming in.
Your fuel tank is empty, even though the speedometer says you were going fast.
Key Takeaway: Profit is the score of the game you played last month. Cash is the fuel you need to stay in the game tomorrow. You need both to survive.
A Clear Comparison of Financial Statements
To make it even clearer, let’s break down what each report tells you, what timeframe it covers, and the main question it answers. This helps you see what a profit and loss statement is and how it fits into the bigger picture.
This simple table breaks down what each financial statement tells you about your business.
| Financial Statement | What It Shows | Timeframe | Key Question It Answers |
|---|---|---|---|
| Profit & Loss | Revenue, expenses, and profit or loss. | Over a period of time (e.g., a month, a quarter). | “Did my business make or lose money during this period?” |
| Balance Sheet | Assets, liabilities, and owner’s equity. | A single point in time (e.g., as of December 31st). | “What is my business’s net worth on this specific day?” |
| Cash Flow | The actual movement of cash in and out of the business. | Over a period of time (e.g., a month, a quarter). | “Where did my cash come from, and where did it go?” |
Looking at just one of these reports gives you an incomplete story. A truly healthy business shows a growing profit on the P&L, a strong financial position on the Balance Sheet, and a positive flow of money on the Cash Flow Statement.
When you learn to read all three together, you get a full 360-degree view of your company. You stop guessing and start knowing.
Common P&L Mistakes to Avoid
Making your first Profit and Loss statement can feel a bit shaky. You’ll probably make a few mistakes, and that’s okay. The good news is that most of them are easy to fix once you know what to look for.
Think of it like this: a clean P&L is like a clear windshield for your business. A messy one is like trying to drive through mud. Let’s look at the most common slip-ups so you can avoid them.
Mixing Your Personal and Business Finances
This is mistake number one, and it’s a big one. It’s so easy to use the business card for a personal dinner or pay for a business tool with your personal card when you’re busy. But doing this makes your P&L pretty much useless.
When you mix personal and business spending, you can’t see if your business is actually making money. It also creates a huge headache at tax time.
Actionable Tip: Open a separate business bank account and get a business credit card from day one. Run 100% of your business money through these accounts. No exceptions. This one habit will save you from so many problems later.
Putting Costs in the Wrong Categories
Another common problem is simply putting expenses in the wrong bucket. You might accidentally put the cost of Facebook ads under “Office Supplies” or a new laptop under “Utilities.” It seems small, but it messes up your report.
If your “Marketing” bucket doesn’t actually have all your marketing costs in it, how can you know if your ads are working? Putting things in the right categories helps you answer important questions like, “How much am I really spending to get a new customer?”
To fix this, make a simple list of your expense categories and stick to it. Your list might look something like this:
- Marketing & Advertising: All costs for promoting your business.
- Software & Subscriptions: Monthly fees for tools you use.
- Office Supplies: Pens, paper, printer ink, etc.
- Professional Development: Classes, workshops, and events.
Forgetting About Small Cash Purchases
Those little cash expenses can add up much faster than you think. Paying for parking with a few bucks from your pocket or buying coffee for a client might not seem like a big deal.
But over a year, these “small” costs can add up to hundreds or thousands of dollars. If they aren’t on your P&L, your profit will look higher than it really is, which gives you a false sense of how you’re doing.
Get in the habit of tracking every penny. Use a simple expense-tracking app on your phone to take a picture of receipts for any cash purchases. This makes sure even the smallest costs are counted, giving you a true bottom line.
Using Your P&L to Grow Your Business
Your Profit and Loss statement isn’t just a report card for last month. Smart business owners use it as a map for the future. You’ve learned how to read the story it tells, and now it’s time to act on that story.
The numbers on that page are begging you to make smarter decisions.
So, you’ve noticed a trend. What’s next? Your P&L is the starting point for asking the tough questions that lead to real growth. It turns vague feelings into specific problems you can actually solve.
Turning Insights into Action
Let’s get practical. If your P&L shows a problem, your job is to be a detective and find out why. The numbers point you in the right direction, and from there, you can make real changes.
Here are some real-world examples:
- Problem: Your Cost of Goods Sold (COGS) is going up, which is eating into your profit on each sale.
- Action: It’s time to talk to your suppliers. Can you get a better price for buying more at once? Can you find another supplier who offers the same quality for less? This one conversation could make every sale more profitable.
- Problem: One of your expenses, like “Software Subscriptions,” has gotten a lot bigger over the last six months.
- Action: Do a software check-up. Are you paying for tools your team doesn’t use anymore? Many companies find they have duplicate subscriptions or are on expensive plans they don’t need. Cutting these costs can instantly boost your profit.
Using Your P&L to Get Money
Besides making decisions for your business, a clean P&L is your best friend when you need money. Whether you’re asking a bank for a loan or talking to investors, they will absolutely ask to see your financial reports.
A strong P&L that shows your sales are growing and you’re making a healthy profit tells a great story. It proves your business works and that you know how to manage money, which makes you a much safer bet.
Banks and investors use your P&L to check on your company’s performance. They don’t just look at the final profit; they look at trends and your ability to control costs. A clear report gives them confidence that their money will be put to good use.
Making smart choices based on your numbers isn’t just good for you; it’s how you build a business that others want to invest in. The right financial data is key, which is why accounting advisory services drive smarter business decisions by turning raw data into a clear plan for growth.
Common Questions About P&L Statements
We’ve covered a lot, but you might still have a few questions. That’s a good thing—it means you’re really thinking about it. Let’s go over some of the most common questions business owners have about the P&L.
How Often Should I Look At My P&L?
For most businesses, looking at your P&L once a month is perfect. Think of it as a regular financial check-up. This gives you enough information to spot trends and fix problems before they get too big.
You’ll need quarterly and yearly P&Ls for things like taxes or getting a loan, but the monthly review is where the real work gets done. It keeps you connected to your business’s financial health and helps you make good day-to-day decisions.
A monthly P&L review isn’t just about looking at numbers. It’s about building a habit of being financially aware that will help your business for years.
Can I Create a P&L Statement Myself?
Yes, you absolutely can, especially when you’re starting out. Modern accounting software like QuickBooks or Xero is designed to make this simple. Once you get in the habit of tracking all your income and expenses, the software can create a P&L for you with just a few clicks.
Doing it yourself is a great way to learn how money flows through your business. But as your company grows, having a professional bookkeeper or accountant do it can save you a lot of time. Plus, an expert can often spot things in the numbers that you might have missed.
What Is The Difference Between Gross Profit and Net Profit?
This is a great question because it gets to the heart of the P&L story. The easiest way to think about it is in two steps.
- Gross Profit is the money left after you subtract the direct costs of making your product or providing your service (COGS). It tells you if the main thing you sell is profitable on its own, before any other bills.
- Net Profit, also known as the “bottom line,” is what’s left after you subtract all your other business expenses—like rent, marketing, software, and salaries.
In short, gross profit shows if your core product makes money. Net profit shows if your entire business makes money. You need to know both to get the full picture.
Feeling like you’re trying to read a foreign language with your P&L? The team at MyOfficeOps can help you build clean books, understand your numbers, and turn those insights into profitable action. Get the financial clarity you need to grow your business.