Learning how to read a balance sheet is all about one simple idea: what you own equals what you owe plus what’s left over for you. It’s a snapshot of your company's money situation on a single day, showing how everything balances out.
What a Balance Sheet Really Shows You
Let’s be honest, staring at a balance sheet for the first time can feel like trying to read a different language. All those rows and finance words can seem like a lot. But what if I told you it’s much simpler than it looks?
Think of a balance sheet as a financial selfie for your business. It captures everything your company owns and owes at one moment in time—like at the end of the day on December 31st. It doesn't show how you did over a month or a year; that's what other reports like the income statement are for. The balance sheet just gives you a clear picture of where things stand right now.
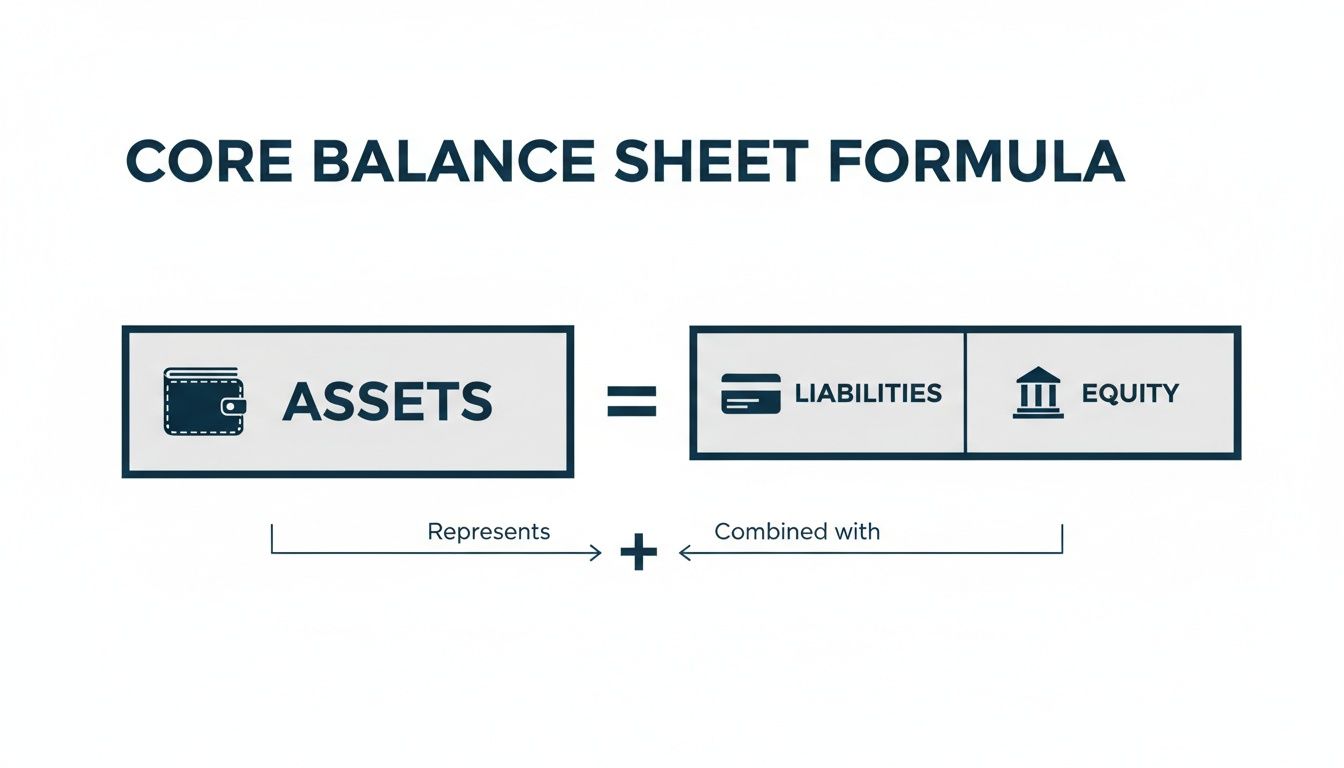
Everything is built on one core rule:
Assets = Liabilities + Owner’s Equity
This isn't just a guideline; it’s a rule. The two sides of this formula must always be equal. That's why it's called a "balance" sheet. If they don't match, something is wrong with the numbers.
The Three Core Parts of a Balance Sheet
Let's break down each piece of that formula. To make it real, imagine we're looking at the balance sheet for a local coffee shop.
Here's a quick rundown of what each part means in plain English.
| Component | What It Tells You in Simple Terms | Example |
|---|---|---|
| Assets | Everything the business owns that has value. | Cash in the register, the espresso machine, bags of coffee beans (inventory), and money a client owes for a catering job. |
| Liabilities | Everything the business owes to other people. | The bank loan for the espresso machine, the monthly rent, and the bill from the milk supplier. |
| Owner’s Equity | The owner's piece of the business; what's left over. | The cash the owner first put in, plus any profits that have been put back into the shop. |
Basically, the stuff you own (assets) is paid for with either borrowed money (liabilities) or your own money (equity). That's it.
This picture shows how the three parts of the balance sheet formula fit together.
Getting this simple idea is the first step to making smarter money decisions. It’s the foundation for everything else you need to know about your business's health.
For a deeper dive into this crucial financial document, the guide How to Read a Balance Sheet Like a Pro Investor is a fantastic resource.
Decoding Your Assets: What Your Business Owns
Let's look at the first big section of the balance sheet: your assets. Think of this as a list of everything valuable your business owns. It’s the "what you own" side of the formula, covering everything from the cash in your bank account to the computer on your desk.
But not all assets are the same. They fall into two main groups, and knowing the difference is key to understanding what your balance sheet is telling you.
Current Assets: The Quick-Cash Stuff
Current assets are anything your business owns that you expect to turn into cash within one year. This group is all about how quickly you can get money if you need it.
These are the things you use for your day-to-day business, like paying employees, buying supplies, and keeping the lights on.
Here are the most common items you'll see:
- Cash and Cash Equivalents: This one’s easy. It’s the money in your bank accounts.
- Accounts Receivable (AR): This is money your customers owe you for things you’ve already sold them. It’s an asset because you have a right to that cash.
- Inventory: If you sell products, this is the value of all the goods you have on the shelf, ready to be sold.
- Prepaid Expenses: Did you pay for your yearly business insurance all at once? That’s a prepaid expense. It's an asset because you've paid for something you’ll use over the next year.
These accounts are all part of your Chart of Accounts, which is the master list for all your money stuff. A well-organized chart of accounts is the foundation for getting these numbers right.
Non-Current Assets: The Long-Term Stuff
Next up are non-current assets, also called long-term or fixed assets. These are valuable things your business owns that you plan to keep and use for more than one year.
You’re not trying to sell these for a quick buck. Instead, they are the tools that help you make money over the long haul.
Examples of non-current assets include:
- Property, Plant, and Equipment (PP&E): This includes things like land, buildings, company cars, machinery, and office furniture.
- Intangible Assets: These are valuable assets you can’t physically touch, like patents, trademarks, and your brand's reputation (often called goodwill).
A Real-World Example
I once worked with a construction client who owned tons of expensive machinery. His non-current assets looked great on paper, giving him a huge "Total Assets" number. But he was always struggling to pay his employees. Why? Because nearly all his value was tied up in that equipment, and he had very little cash—a current asset.
This story shows why just looking at the "Total Assets" number isn't enough. You have to understand the mix between current and non-current assets to see if your business has enough cash to run smoothly. Having a lot of valuable equipment is great, but it won’t pay your suppliers this week.
This balance is critical for survival. Studies show that small businesses with a healthy amount of current assets compared to their short-term bills survive 25% longer during hard economic times. It’s all about having the flexibility to handle surprises.
Understanding Liabilities: What Your Business Owes
Now we flip to the other side of the balance sheet formula: liabilities. This section lists everything your business owes to other people, vendors, or banks. I know seeing the word "debt" can be a little scary, but the truth is, nearly every healthy, growing business has some.
Debt isn't the enemy. The key is understanding what kind of debt you have and whether it’s helping or hurting you. Just like with assets, we’ll split liabilities into two simple groups: current and non-current. This immediately shows you what needs to be paid back soon versus what you have more time to pay off.
Current Liabilities: Your Short-Term Bills
Current liabilities are all the debts you need to pay within one year. Think of these as your business's immediate bills—the ones that are always coming up.
Managing these is critical for your day-to-day survival. If your current liabilities get too big compared to your current assets, you can run into a cash problem, even if your business is profitable.
Here are the most common types you'll see:
- Accounts Payable (AP): This is the money you owe to your suppliers. If you're a painter and you bought a bunch of paint on credit, that bill sits in AP until you pay it.
- Accrued Expenses: These are costs you've racked up but haven't gotten the bill for yet. A good example is employee wages—you owe your team for the work they did this week, even if payday isn't until next Friday.
- Short-Term Loans: This covers any part of a loan that’s due within the next 12 months, including money you owe on business credit cards.
Non-Current Liabilities: The Long Game
On the other hand, non-current liabilities are your long-term debts. These are debts that you don't have to pay back in full for at least a year.
These are usually the bigger debts that help a business grow. For instance, you might take out a long-term loan to buy a building or a big piece of equipment that will help you make money for years.
Examples of non-current liabilities include:
- Long-Term Loans: This is the classic business loan you'd get from a bank to expand, buy a building, or purchase expensive machinery.
- Bonds Payable: Bigger companies sometimes sell bonds to raise money from investors, which they then pay back over many years. It’s less common for small businesses but good to know about.
- Deferred Tax Liabilities: This is a more complex item, but it's basically taxes that are owed but won't be paid until a later date because of accounting rules.
A Marketing Agency's Close Call
I remember a marketing agency client that looked great based on their sales. They were getting big clients and making more money every month. But when we looked at their balance sheet, we saw a big problem. They had used short-term credit cards (current liabilities) to pay for a huge office renovation. Their current liabilities were sky-high, while their cash was very low. They were just one slow-paying client away from not being able to pay their employees.
This real-world situation is exactly why knowing how to read a balance sheet is about more than just looking at profit. It's about seeing the full picture. That agency needed to change its debt into a long-term loan to free up its daily cash and get back on solid ground.
For small and midsize businesses, especially here in the Greater Philadelphia area, understanding debt is critical. It helps prevent the very problems that caused 29% of US firms to fail in 2024—they simply borrowed too much money. For a broader look at global debt trends, this UNCTAD report on the world of debt offers some valuable context.
Owner’s Equity: The True Value of Your Business
We’ve covered what your business owns (assets) and what it owes (liabilities). Now we get to the final piece, and in my opinion, the most exciting one: owner’s equity.
Think of it this way: if you sold everything you own and used that money to pay off every single debt, the cash left over would be your equity. It’s the true, bottom-line value of your piece of the business. It’s what you've built.
This number tells a powerful story. Seeing your equity grow over time is one of the best signs that your business is getting healthier. It’s proof that your hard work is paying off.
The Building Blocks of Equity
So, what makes up this important number? It’s not just one thing. The owner's equity section on your balance sheet is usually broken down into a couple of key parts. Understanding these helps you see exactly how your company’s value is changing.
Here’s what you’ll usually find:
- Common Stock or Contributed Capital: This is the money that was first put into the business to get it started. It’s the cash you (or other investors) paid for a piece of the company.
- Retained Earnings: This is a huge one. Retained earnings are the profits your business has made over time that you’ve put back into the company instead of taking out for yourself.
Think of retained earnings as your business saving its own money to grow. A healthy, growing retained earnings balance is a great sign. It means your company is making a profit and you’re using that money to get even stronger.
Why Equity Matters for Your Future
Knowing how to read the equity section is about more than just history; it's about planning your next move. For many business owners, their company is their biggest asset. Its equity might be their retirement fund or their family's security.
A Real-Life IT Firm Sale
I once advised an IT consulting firm whose owner was getting ready to sell. When potential buyers came to the table, they didn't just look at the firm's sales numbers. They spent a lot of time looking at the owner's equity on the balance sheet. A strong and growing equity told them the business was stable, profitable, and well-managed. This made the business much more attractive and led to a much higher price.
This isn't just a one-off story. The bottom line of any balance sheet is your equity, and it signals financial strength for either growth or a future sale. For businesses like IT firms looking to sell, a strong equity position has been shown to result in 50% higher valuations in recent deals. Firms with a high return on equity (ROE) also grow their sales much faster than their competitors. Learn more about how global wealth trends are impacting business valuations from PwC's latest M&A reports.
Using Key Ratios to Find Real Insights
Reading the individual lines on your balance sheet is a great start. But the real magic happens when you start connecting the numbers. This is where a few simple calculations, called financial ratios, turn that report into a powerful tool for making decisions.
Don’t worry, this isn’t hard math. These are four simple but very telling ratios you can figure out in a few minutes. They help you answer the big questions about your company's financial health.
The Current Ratio: Answering "Can I Pay My Bills?"
The first and most basic test of your financial health is the current ratio. It answers a simple, important question: do you have enough short-term assets to cover your short-term debts? In other words, can you pay all the bills due in the next year?
Here’s the simple formula:
Current Ratio = Current Assets / Current Liabilities
Imagine your coffee shop has $50,000 in current assets (cash, inventory, money customers owe you) and $25,000 in current liabilities (bills from suppliers, payroll).
Your calculation would be: $50,000 / $25,000 = 2.0
A current ratio of 2.0 is usually considered healthy. It means you have $2 in current assets for every $1 you owe soon. A ratio below 1.0 is a red flag. It means you might have trouble paying your bills on time, which can quickly turn into a cash crisis.
The Quick Ratio: A Stricter Liquidity Test
The quick ratio, sometimes called the "acid-test ratio," is like a tougher version of the current ratio. It asks an even stricter question: can you pay your short-term bills without having to sell any of your inventory?
This is important because inventory can sometimes be hard to sell quickly. The quick ratio takes inventory out of the formula to give you a clearer look at your ability to get cash fast.
The formula is:
Quick Ratio = (Current Assets – Inventory) / Current Liabilities
Let’s go back to our coffee shop. They have $50,000 in current assets, but $15,000 of that is tied up in coffee beans, milk, and paper cups. They still have $25,000 in current liabilities.
The calculation is: ($50,000 – $15,000) / $25,000 = 1.4
A quick ratio of 1.0 or higher is a good sign. It means you can cover all your immediate debts without relying on selling a single thing off your shelves. It shows you have a strong cash position.
Why This Matters So Much
A business can look profitable on paper but still fail because it runs out of cash. These liquidity ratios—current and quick—are your early warning system. They tell you if you have enough of a cash cushion to handle the day-to-day bumps in the road.
One important part of your current assets is accounts receivable—the money your customers owe you. To get a better handle on how quickly you're collecting that cash, it helps to understand your accounts receivable turnover rate, which works hand-in-hand with these balance sheet ratios.
Debt-to-Equity Ratio: Who Really Owns Your Business?
This next ratio looks at your company's long-term stability. The debt-to-equity ratio tells you how much of your business is funded by debt versus how much is funded by your own money (equity).
It basically answers the question: "How much do I rely on borrowed money versus my own investment?"
Here's the formula:
Debt-to-Equity Ratio = Total Liabilities / Total Owner’s Equity
Let's say your coffee shop has $100,000 in total liabilities (including a long-term loan for the espresso machine) and $80,000 in owner's equity.
Your calculation: $100,000 / $80,000 = 1.25
What's a "good" number here changes by industry. But, a general rule is that a ratio of 2.0 or higher can be a sign of risk. It means you have twice as much debt as equity, and lenders have a bigger claim on your assets than you do. A lower ratio, closer to 1.0, often means a more stable, less risky business.
Working Capital: Your Operational Breathing Room
Finally, let’s talk about working capital. This isn't a ratio, but a simple dollar amount that shows you how much cash is left over to run your daily business after you cover your short-term bills. It's your financial breathing room.
The formula is as simple as it gets:
Working Capital = Current Assets – Current Liabilities
For our coffee shop: $50,000 – $25,000 = $25,000
This $25,000 is the money you have available to pay salaries, buy new inventory, and handle unexpected costs. Having a positive working capital number is key for smooth operations. If this number turns negative, it means your short-term debts are more than your short-term assets, and you’ll likely face a cash shortage very soon.
These four calculations are a great starting point for understanding the story your balance sheet is telling you. To make it even easier, here’s a quick reference table.
Essential Balance Sheet Ratios at a Glance
| Ratio Name | What It Tells You | Simple Formula |
|---|---|---|
| Current Ratio | Do you have enough short-term stuff to cover short-term bills? | Current Assets / Current Liabilities |
| Quick Ratio | Can you pay immediate bills without selling any inventory? | (Current Assets – Inventory) / Current Liabilities |
| Debt-to-Equity | How much of your business is funded by debt vs. your own money? | Total Liabilities / Total Owner’s Equity |
| Working Capital | How much cash is left to run daily operations after paying bills? | Current Assets – Current Liabilities |
Keep this table handy. Calculating these numbers each month is one of the most powerful habits a business owner can develop. It moves you from just looking at your finances to truly understanding them.
Common Questions About Reading a Balance Sheet
Even after you get the hang of it, a few questions always seem to pop up. Let's tackle some of the most common ones we hear from business owners, breaking them down into simple answers to help you feel more confident.
How Often Should I Look at My Balance Sheet?
For most small businesses, looking at your balance sheet monthly is a great habit. Think of it as a regular check-up on your company's financial health.
Now, if your business is growing really fast or going through a tough time, you might want to look at it weekly. A deep dive with your bookkeeper or advisor every quarter is also a smart move for bigger-picture planning. The key is to be consistent.
What Is the Biggest Red Flag to Look For?
One of the biggest red flags is negative owner's equity. This is a big deal. It means your total debts are greater than your total assets—in plain English, you owe more than you own. It’s a clear sign of serious financial trouble.
Another major red flag is having very little cash combined with high accounts payable (your current bills). This points to a possible cash flow problem, where you might struggle to pay your suppliers or your employees, even if you’re making sales.
Can a Balance Sheet Be Wrong?
Yes, absolutely. A balance sheet is only as good as the bookkeeping behind it. Even simple human errors can throw the whole report off.
Common mistakes I’ve seen include:
- Typing in the wrong number: A simple typo can completely change the financial picture.
- Putting a transaction in the wrong category: Listing a long-term loan as a current bill can make you panic for no reason.
- Forgetting to record something: If you buy a new truck (an asset) but it never gets recorded, your balance sheet is incomplete.
This is exactly why having clean, professional bookkeeping is so important. A wrong balance sheet can lead you to make bad business decisions based on bad information, which can hurt all your hard work.
Feeling overwhelmed trying to make sense of it all? You don't have to do it alone. The team at MyOfficeOps specializes in turning complex financial data into clear, actionable insights for business owners just like you. Let us handle the numbers so you can focus on running your business. Visit us at https://myofficeops.com to schedule a discovery call and see how we can help.