A chart of accounts (COA) is a list of every single account your business uses to keep track of its money. Think of it as a table of contents for your company's finances. It gives every dollar a specific home, so you can see exactly where your money comes from and where it goes.
The Financial Map Every Business Needs

Imagine trying to understand your business's money without any organization. It would be like a library with books thrown all over the floor. You'd never find what you need. A chart of accounts is the shelving system for that library.
It's the main tool for your entire accounting system, giving you a clear, organized view of every transaction.
Without this structure, creating financial reports like a Profit and Loss statement or a Balance Sheet would be a huge mess. Every payment you make and every dollar you earn gets sorted into a specific account on your COA.
Why It's More Than Just a List
The COA is like the backbone of your business's financial story. It doesn’t just list accounts; it explains the relationship between what you own (Assets), what you owe (Liabilities), and what your business is worth (Equity).
This simple setup helps you answer important questions, like:
- Where is our money going? You can easily see if you're spending too much on software or office snacks.
- Which services make the most money? By tracking income from different services, you know what's really working.
- Is the business healthy? It gives you the numbers you need to check your cash flow and see if you're on solid ground.
A good chart of accounts is the first step to understanding your money. It turns messy numbers into a tool for making smarter decisions for your business.
The Building Blocks of Your Finances
This idea isn't new. People started organizing financial accounts in a big way back in the 1950s when businesses needed better ways to plan for the future. This helped create the organized systems we use today. If you're curious, you can read more about the history of accounting to see how things have changed.
At its heart, every chart of accounts is built around five main types of accounts. If you understand these five groups, you can understand your business's whole financial picture.
This organized way of doing things makes sure your financial reports are accurate and easy to read. When every transaction has a home, you can stop guessing about your finances and start making smart moves based on real numbers.
Why a Chart of Accounts Matters for Your Business
So, you have this organized list of accounts. What does it actually do for you?
Think of it like trying to find your way in a new city. You could use a crumpled map you drew yourself, or you could use a GPS that tells you exactly where to turn. One is stressful and confusing, while the other gives you total clarity. A well-built chart of accounts is your business's financial GPS.
A good chart of accounts gives you a clear, real-time view of your financial health. It’s not just some boring accounting task; it’s the engine that powers your most important business reports.
Without a clean COA, your financial statements are just a jumble of numbers. But with one, you can spot overspending in minutes, see which services are your real money-makers, and make smart decisions about what to do next.
Turning Messy Data Into a Powerful Tool
Let me give you a real-world example. I once worked with a marketing agency owner named Sarah. In her first year, she put every single expense into one big bucket called "Business Costs." Software, ads, rent, and client lunches were all mixed together. When tax time came, her accountant asked why her costs were so high one month, and she had no idea.
After we helped her set up a proper chart of accounts, everything changed. We created specific accounts for her expenses:
- 6010 – Software Subscriptions
- 6020 – Online Advertising
- 6030 – Office Rent
- 6040 – Client Lunches
The next time her ad costs jumped up, she saw it right away. The COA showed her that the ad spending for one project had doubled, but the money coming in from that project hadn't. She was able to change her plan, cut the project that was losing money, and save thousands of dollars.
This is the true power of a chart of accounts. It turns financial chaos into clear information that helps you make good decisions instead of just reacting to problems.
Making Big Decisions with Confidence
A clean COA does more than just track spending; it’s the foundation for your entire financial strategy. It makes stressful times like tax season much easier because all your expenses are already perfectly organized for your accountant.
Need to apply for a business loan? Banks want to see organized, professional financial statements. A detailed chart of accounts shows that you have a good handle on your business's finances, which makes them more likely to say yes. A solid COA is what lets you build financial models that drive business growth, moving you from a tangled mess of spreadsheets to a clear path forward.
In the end, it helps you understand your business on a much deeper level. You can create reports that compare how different departments are doing with total confidence in the numbers.
This organized data is what powers the key reports that show your business's performance. For example, it directly feeds into your Profit and Loss statement, which is key for understanding if you're making money. To see how these pieces fit together, check out our guide on what is a Profit and Loss statement.
How to Structure Your Chart of Accounts
Alright, let's talk about how to actually put a chart of accounts together. It might sound complicated, but the main idea is pretty simple. You create a numbering system that gives every account a unique address, making everything easy to find and organize.
Think of it like the aisle numbers in a grocery store. The first number tells you which section you're in (like Assets or Expenses), and the numbers that follow point you to the exact item on the shelf—or in this case, the specific account. It keeps everything in order.
The Logic Behind the Numbers
Most accounting software, like QuickBooks Online, uses a standard numbering pattern. You don't have to follow it, but it’s a great place to start because it’s logical and everyone understands it. This structure makes sure that similar accounts are automatically grouped together on your financial reports.
Here’s a look at how those number ranges usually work for your accounts:
- 1000s – Assets: Everything your business owns. Think cash in the bank, equipment, and money customers owe you.
- 2000s – Liabilities: Everything your business owes. This includes credit card debt, loans, and bills you have to pay.
- 3000s – Equity: The value of your business—what's left after you subtract what you owe from what you own.
- 4000s – Revenue: All the money your business earns from selling things or providing services.
- 5000s – Cost of Goods Sold (COGS): The direct costs of making your product or providing your service.
- 6000s & 7000s – Expenses: All the other money you spend to run the business, like rent, software, and salaries.
This infographic shows how a well-organized chart of accounts provides the clear data needed to generate key reports and make better business decisions.
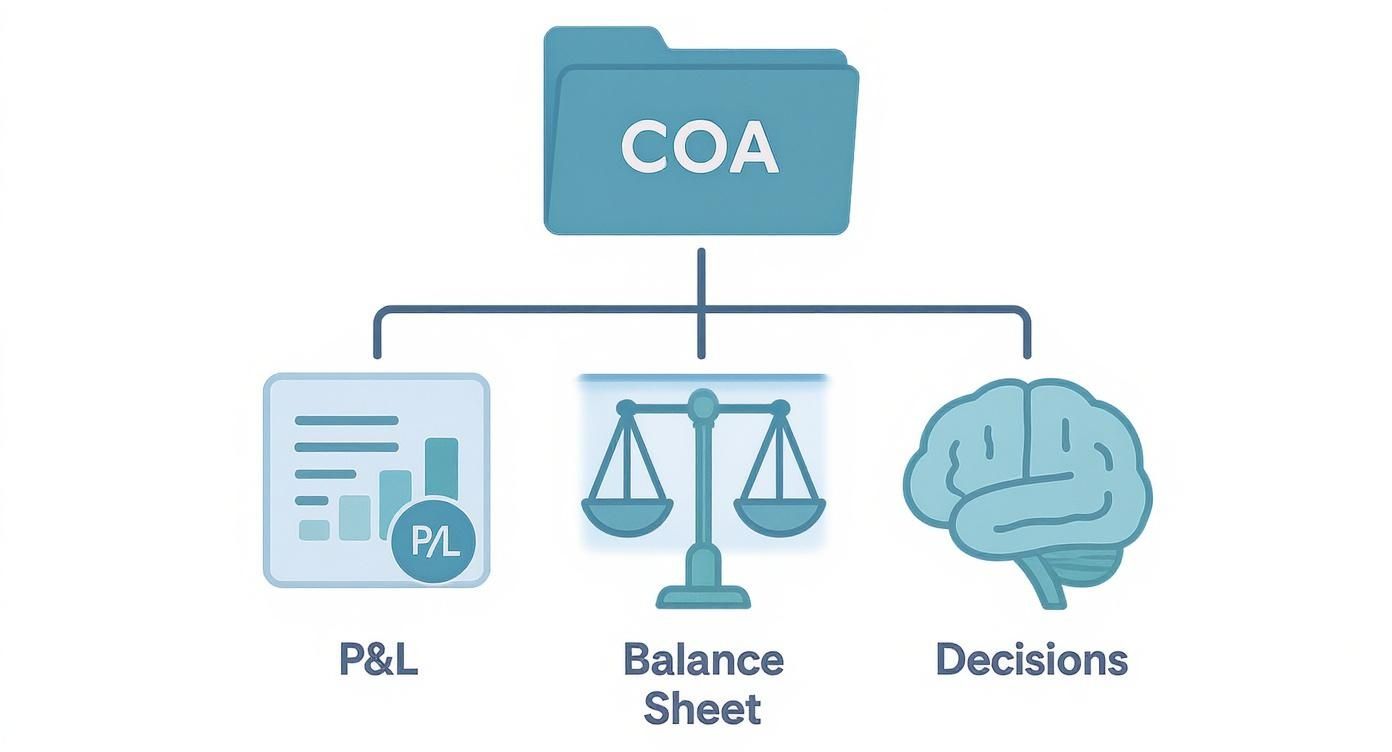
As you can see, the COA is the foundation. Without it, your financial reports would be a mess, and making good choices would be just a guessing game.
Going Deeper with Sub-Accounts
This is where the real magic happens. Instead of having one big account like "Marketing," you can create smaller sub-accounts to see exactly where your money is going. This is how you get real information about your spending.
Using that numbering system, you can add more detail in a logical way.
For example, your main "Marketing Expense" account might be 7200. You could then create sub-accounts like this:
- 7210 – Social Media Ads: To track what you spend on sites like Facebook or LinkedIn.
- 7220 – Email Software: For the cost of your email marketing tool.
- 7230 – SEO Services: To watch how much you're investing in search engine optimization.
The goal is to create a structure that is detailed enough to be helpful but not so complicated that it becomes a pain to manage. Find the right balance for your business.
This level of detail is a game-changer. Suddenly, you can answer important questions like, "Is our spending on social media ads actually bringing in new customers?" or "How much are we really paying for software each month?"
By breaking down your main accounts into more specific sub-accounts, you give yourself the power to analyze your finances with precision. This clarity is what turns a simple list of accounts into a powerful tool for business growth.
Real-World Chart of Accounts Examples
Theory is great, but seeing how a chart of accounts works for a real business makes everything click. A COA isn’t one-size-fits-all; it has to match how your specific business makes and spends money. A freelance writer needs to track different things than a construction company, and that’s the whole point.
Let’s look at a few examples to see what this actually looks like. We'll explore sample COA setups for different businesses to give you a practical starting point. Think of these as templates you can change for your own company, so you’re not starting from scratch.
Example for a Professional Services Business
Imagine you run a small marketing agency. Your business is all about providing services, not selling physical products. Your chart of accounts needs to show that, focusing on tracking different types of service income and the costs of your team and tools.
Your income section would be more detailed than just a single "Sales" account. You’d want to know which services are really driving your business.
- 4010 – Consulting Fee Income: For your strategy work.
- 4020 – Project-Based Income: Money from one-off projects like building a website.
- 4030 – Retainer Income: The monthly fees you get from ongoing clients.
This simple separation immediately tells you where your most reliable money is coming from. On the expense side, your biggest costs will likely be your employees and the software they use.
- 6100 – Salaries & Wages: For your full-time staff.
- 6150 – Contractor Payments: To track what you pay freelancers.
- 6200 – Software Subscriptions: For all your marketing and project management tools.
By creating these specific "buckets," you can easily see if your software costs are going up or if you're relying too much on freelancers instead of your own team. It turns a vague list of expenses into a clear story about how you operate.
Example for a Construction Company
Now, let's switch to a construction company. This business has a totally different way of handling money. You're dealing with big project costs, materials, other contractors, and long timelines. Your chart of accounts must be built to handle all of this.
One of the most important account groups for any builder is Cost of Goods Sold (COGS), but for construction, it's way more detailed. You need to track every single cost for each specific job.
For a construction business, the chart of accounts is the key to knowing if a job made money. Without it, you’re just guessing.
Your COGS section might look something like this:
- 5010 – Direct Labor: Wages for the crew working on the job site.
- 5020 – Subcontractor Costs: Payments to plumbers, electricians, and other specialists.
- 5030 – Building Materials: The cost of wood, concrete, and everything else.
- 5040 – Equipment Rental: For machines you rent for a specific job.
Construction accounting also has special asset and liability accounts that a marketing agency would never need. For example, Work in Progress (WIP) is a key asset account that tracks the value of unfinished projects. This helps you get a true picture of your company's financial health, even when projects take months or years. Managing these details is essential, and you can learn more about the specifics of accounting for construction companies to see how deep it goes.
Example for a Real Estate Business
A real estate agency has its own unique financial model. The business is all about commissions, agent fees, and marketing properties. The chart of accounts has to be set up to track these specific types of income and costs with total clarity.
Income isn't just "sales." It’s broken down by the type of deal.
- 4100 – Commission Income – Sales: Your main income, from selling properties.
- 4200 – Commission Income – Leases: Money from rental agreements.
- 4300 – Referral Fees Earned: Income from sending clients to other agents.
This setup helps you see which part of your business is making the most money. Maybe your rental commissions are higher than you thought, or maybe referral fees are a hidden source of income.
On the expense side, the costs are directly tied to your agents and marketing the properties. You'll want specific accounts to watch these key spending areas.
- 6500 – Agent Commission Splits: The part of the commission you pay out to your agents. This is often the biggest expense.
- 6600 – Listing Marketing: Costs for photography, online listings, and open house signs.
- 6700 – Desk Fees & Dues: Payments for MLS access and other memberships.
By setting up the chart of accounts this way, a real estate broker can quickly see how profitable their team is and if their marketing is working. It provides the financial map needed to succeed in the competitive real estate market.
Industry-Specific Account Examples
As we've seen, the accounts that matter most can change a lot from one industry to another. The table below shows some of these key differences, showing how a COA is customized to tell the right financial story for each type of business.
| Industry | Key Revenue Accounts | Key Expense Accounts |
|---|---|---|
| Professional Services | Retainer Income, Project Fees | Contractor Payments, Software Subscriptions |
| Construction | Contract Revenue, Change Order Revenue | Direct Labor, Subcontractor Costs, Materials |
| Real Estate | Sales Commissions, Lease Commissions | Agent Commission Splits, Listing Marketing Fees |
| Healthcare | Patient Service Revenue, Lab Fees | Medical Supplies, Malpractice Insurance |
These examples just give you a small peek, but they show an important point: your chart of accounts should be a living document that reflects how your business actually works. A generic COA gives you generic information, but a customized one gives you the specific details you need to make smarter decisions.
Setting Up and Maintaining Your Chart of Accounts

Alright, you understand the setup. Now let's talk about putting your chart of accounts into action. Getting it into accounting software like QuickBooks or Xero is the easy part; the real work happens before you click a single button. It all starts with planning.
Think of it like building with LEGOs. You wouldn't just start snapping bricks together without a plan. First, you'd picture what you want to build, then you'd gather the right pieces. It's the same with your COA. You need to plan the accounts you'll need based on your business and how you want to track your money.
A key first step is understanding how to choose accounting software that actually fits your business. The right program will make setting up and managing your chart of accounts much simpler.
Best Practices for a Clean COA
Once your COA is set up, the goal is to keep it clean and useful. A messy, overgrown chart of accounts leads to confusing reports and bad decisions. Building good habits from the start will save you from a huge cleanup project later on.
Here are a few simple rules to live by:
- Don't Create Accounts on the Fly: Before adding a new account, stop and ask, "Do I already have an account that works for this?" For example, if you buy a new software tool, it should probably go into your existing "Software Subscriptions" account, not a brand-new one you just made up.
- Use Clear Names and Descriptions: Name your accounts something that you and your team will understand right away. "7210 – Social Media Ads" is much better than "7210 – Mktg." Adding a short description in your accounting software can also explain what each account is for.
- Resist Getting Too Detailed: I know it's tempting to create an account for every tiny expense, but this quickly makes your reports cluttered and hard to read. You need to find the sweet spot between useful detail and simplicity.
The Annual Review
Your business changes over time, and your chart of accounts should change with it. What worked last year might not be giving you the right information today. That’s why an annual review of your COA is so important.
Set aside time once a year to look over your accounts. Ask yourself these key questions:
- Are there accounts we never use? If so, you can probably hide or merge them to clean things up.
- Are there new expenses or ways we're making money that we need to track? Maybe you launched a new service that needs its own income account.
- Does the current setup still make sense for how our business works today?
This idea of organizing finances has been around for a long time. Governments and big companies have been improving these methods for decades. The Bank of England, for instance, started publishing detailed financial reports way back in 1963, showing how the basic ideas behind a COA have been pushing for more clarity for a long time.
Maintaining your chart of accounts isn't a one-time job; it's an ongoing habit. A little bit of care each year makes sure your financial data stays accurate, relevant, and powerful.
Properly setting up and maintaining your chart of accounts is the foundation of good financial management. If this feels like a lot, professional help can make all the difference. Explore our expert bookkeeping services to see how we can build a perfect COA for your business from day one.
Feeling a little lost in all this talk about accounts, numbers, and structure? You're not alone. Building the right chart of accounts from scratch is precisely where most business owners get stuck, and a messy setup now will absolutely cause headaches down the road.
This is the point where getting some expert help can be a total game-changer. Think of it like this: you could try to wire a new room in your house yourself, armed with a confusing diagram and a prayer. You might get the lights to turn on, but you might also create a serious fire hazard. Or, you could hire an electrician who gets it done right, safely, and in a fraction of the time.
How We Build Your Financial Framework
At MyOfficeOps, we're the expert electricians for your financial wiring. We specialize in building a chart of accounts that actually works for your specific business. We don't just hand you a generic template and wish you luck. Our first step is to really get to know your business, your industry, and what you’re trying to accomplish.
Our entire process is built around you:
- We Listen First: We start by learning about your revenue streams, your biggest expenses, and the financial questions that are keeping you up at night.
- We Build a Custom COA: Using that insight, we design a structure that gives you the specific reports you need to make smarter, faster decisions.
- We Clean Up the Mess: If you already have a chart of accounts that looks like a tangled bowl of spaghetti, don't worry. We’ll organize it, merge duplicate accounts, and create a clean foundation for your books.
The goal isn't just to have a chart of accounts; it's to have one that gives you crystal-clear financial reports. Your numbers should become easier to understand, not more confusing.
With a powerful COA built by our team, the result is simple: you get financial reports you can actually trust. That clarity allows you to make confident business decisions and frees up your time and mental energy to focus on what you do best—running and growing your company.
Let us build the financial framework so you can focus on building your business.
Common Questions About the Chart of Accounts
Even with a clear map, it’s normal to have a few questions when you're dealing with something as important as your chart of accounts. Let's clear up some of the most common things that confuse business owners.
Getting these basics right is the difference between a financial system you can trust and one that just creates more questions.
Is the Chart of Accounts the Same as a General Ledger?
This is probably the most common mix-up, but the answer is a big no.
Here’s the simplest way to think about it: The chart of accounts is the table of contents for your financial books. It’s just the list of all your accounts and their account numbers. It provides the structure, the skeleton.
The general ledger (GL) is the actual book. It contains every single transaction that has ever happened in each of those accounts. So, the chart of accounts is the map, but the general ledger tells the complete story of your financial journey.
How Many Accounts Should I Have?
There’s no magic number here, and this question trips up a lot of people. The goal is to find that sweet spot between being too simple and getting lost in too much detail.
If you have too few accounts—like one giant bucket called "Expenses"—you have no idea where your money is actually going. On the other hand, if you create hundreds of super-specific accounts, your financial reports will be a mile long and impossible to read. According to Xero, you can have up to 999 accounts, but they suggest staying under 700 to keep things running smoothly.
A good rule of thumb is to create an account only when the information it gives you will help you make a better business decision. If it doesn't give you a helpful piece of information, it's just adding clutter.
For most small to medium-sized businesses, a chart of accounts with 50 to 150 accounts is a great place to start. It gives you enough detail to be useful without becoming a headache to manage.
Can I Change My Chart of Accounts Later?
Absolutely! In fact, you should. Your business isn't set in stone, so your financial map shouldn't be either. As your company grows and changes, your chart of accounts needs to keep up.
Maybe you add a new service, which means you'll need new income accounts to track it. Or maybe you open a new location, which needs new expense accounts for rent and utilities. It’s a smart move to review your COA at least once a year to make sure it still matches how your business works.
Just be careful: never delete old accounts that have transactions in them. Doing that can cause huge accounting problems. Instead, most software lets you "archive" or "inactivate" them, which hides them from your active list while keeping your old data safe.
Feeling a bit overwhelmed? That's completely normal. Building the right COA is where many business owners get stuck. MyOfficeOps can help you clean up an existing messy COA or build a powerful one from scratch, giving you crystal-clear financial reports. Learn more about how we can help at https://myofficeops.com.