
You're probably looking at a profit and loss statement, a bank balance, maybe an aging report, and still asking the same question: What's going on in this business?
That's the spot a lot of owners get stuck in. Sales might be up. The checking account might look decent today. But you still can't answer the essential questions fast enough. Can you afford another hire? Are your projects making money? Are slow-paying customers choking your cash flow?
That's where a good cfo report example helps. Not a giant board packet built for a public company. A practical report built for a contractor, a dental practice, an agency, or any owner-operated business that needs clear answers without digging through ten tabs and three accounting exports.
What Is a CFO Report (And Why It's Not Just Another Spreadsheet)
A CFO report is the difference between having numbers and understanding what the numbers mean.
Most owners already have reports. They've got a P&L. They've got a balance sheet. They've got something from QuickBooks or their bookkeeper. The problem is that those reports often tell you what happened, but not what to do next.

Think of it like a dashboard
Your car dashboard doesn't show every bolt, hose, and wire. It shows the few things that help you drive safely. Speed. Fuel. Engine temperature. Warning lights.
A CFO report should work the same way. It should show the handful of financial signals that help you run the business without guessing.
For a small business owner, that usually means questions like these:
- Cash: Do we have enough room to cover payroll, vendors, and taxes?
- Profit: Are we keeping enough after labor, software, rent, and overhead?
- Collections: Are customers paying fast enough?
- Operations: Is growth helping us, or just making the business harder to fund?
A lot of online examples miss this completely. They look like trimmed-down board decks for big companies, not owner-ready reporting for real SMBs. One advisory source points out that many owner reports are still too cash-based or incomplete to support strategic decisions, which is exactly why SMBs need reporting tied to cash, payroll, and receivables rather than generic templates from larger firms (Kirsch CPA on monthly financial visibility gaps).
What makes it different from bookkeeping reports
Bookkeeping is about recording activity correctly. A CFO report is about interpreting that activity.
A plain P&L might show higher revenue this month. A CFO report asks whether that revenue came from healthy work, whether margins held up, and whether the cash has arrived.
Practical rule: If your report doesn't help you decide whether to hire, raise prices, cut costs, or tighten collections, it's not a CFO report. It's just accounting output.
That's why the best version is short, readable, and built around decisions. For many owners, a cleaner reporting format like financial reporting for small business is more useful than another raw export from the accounting system.
The Anatomy of an Actionable CFO Report
A strong CFO report doesn't try to impress you with volume. It tries to make the business easier to manage.
The cleanest reports I've seen usually have four parts. If one of these is missing, the report gets harder to use.
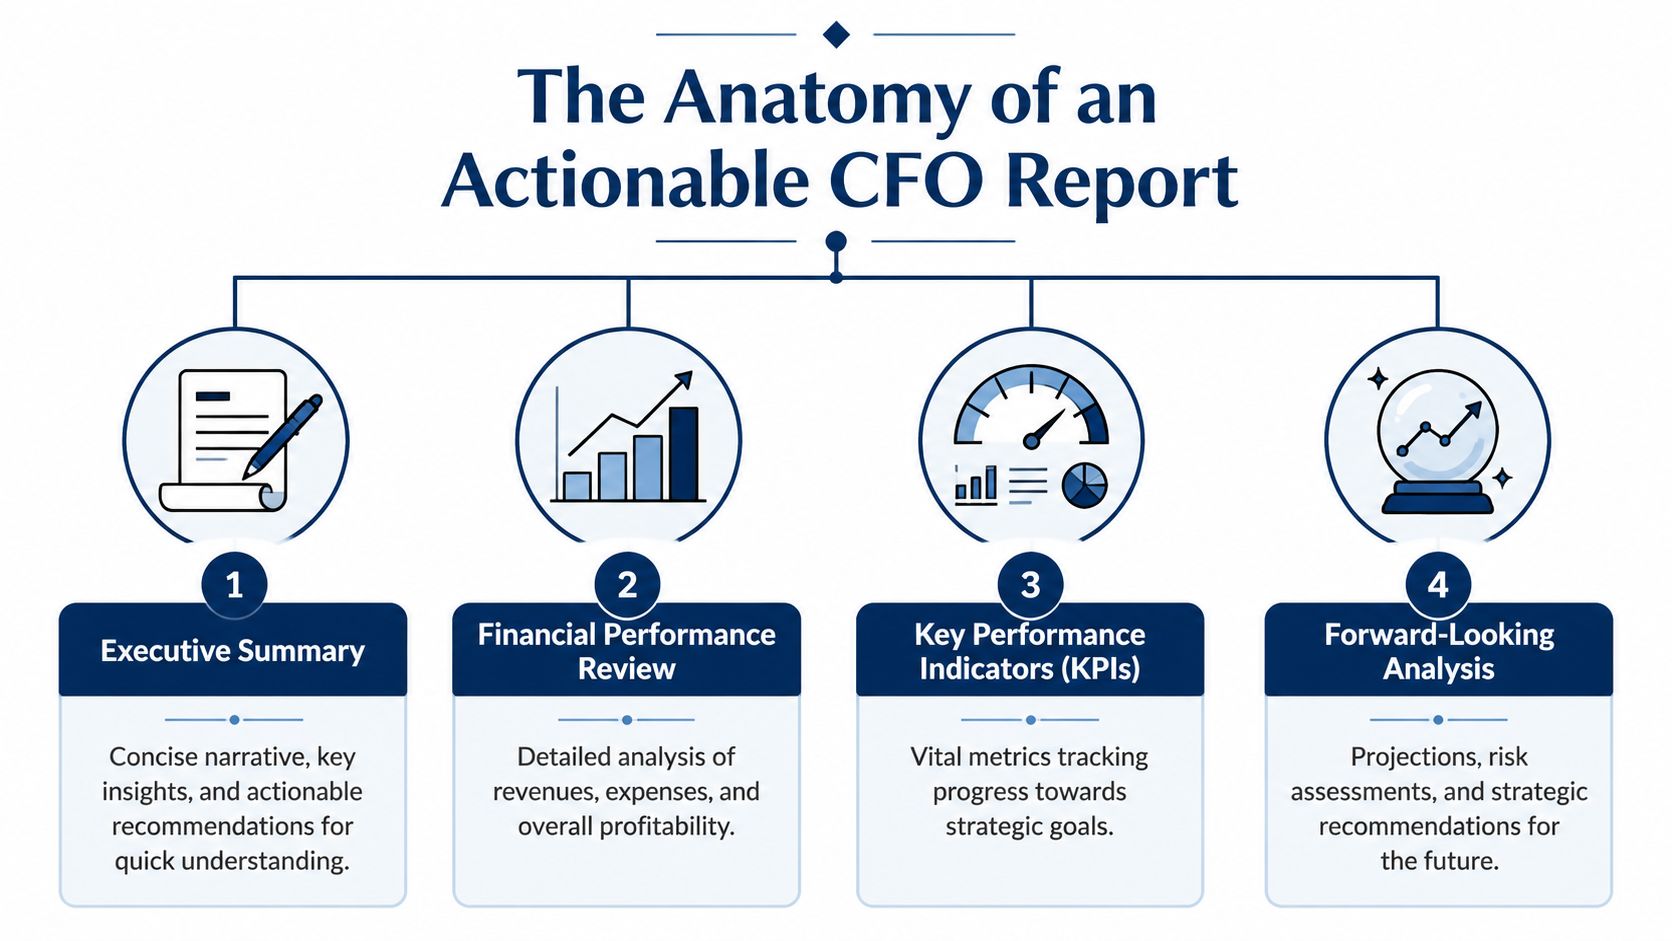
Executive summary
This is the first thing the owner should read. One page is enough.
It should answer three simple questions in plain English. What changed? Why did it change? What needs attention now?
For example:
Revenue improved, but operating cash flow fell because receivables stretched and payroll rose ahead of collections.
That sentence is worth more than five pages of untouched statements because it points to action.
KPI dashboard
This is the visual core of the report. Not every metric belongs here. Only the ones that help you steer.
Oracle's CFO KPI guidance highlights metrics such as operating cash flow, cash conversion cycle, working capital, accounts payable turnover, accounts receivable turnover, return on equity, cash runway, days sales outstanding, days payable outstanding, quick ratio, and debt-to-equity ratio. Oracle also notes that revenue growth is calculated as (current revenue – prior period revenue) / prior period revenue × 100, which makes trend reporting easier to standardize in a monthly dashboard (Oracle CFO KPI guidance).
For an SMB, you won't use every one of those every month. But that list is useful because it separates vanity metrics from decision metrics.
Condensed financials
You still need the core statements. Just don't dump them in raw form and call it done.
A good CFO report includes a shortened P&L, a balance sheet view, and a cash-focused summary. The point isn't detail for detail's sake. The point is to highlight what moved and what matters.
A smart condensed view often shows:
- Revenue and gross profit: So you can see if sales quality is holding up
- Major operating expenses: Payroll, contractors, occupancy, software, marketing
- Cash position and working capital: So surprises don't hit you late
- Debt and obligations: Especially if loan payments are tightening flexibility
Forecast versus actual
This is the part many small businesses skip, and it's usually the part they need most.
Without forecast-versus-actual reporting, you only know what happened. You don't know whether you're on plan, off plan, or drifting.
Here's a simple way to consider it:
| Report piece | What it tells you |
|---|---|
| Current month actuals | What happened |
| Prior month comparison | What changed |
| Budget or forecast comparison | Whether you're on track |
| Commentary | Why it happened and what to do |
The report should help an owner say, “We planned this, we got that, and here's what needs to change.”
If your current reporting package can't do that, it isn't broken. It's just unfinished.
Real CFO Report Examples for Your Business
Most owners don't need another template. They need to see what a useful report looks like in a business that feels like theirs.
Below are two practical examples. The numbers are shown qualitatively on purpose. What matters here is the structure, the commentary, and the kind of decisions the report supports.
Example one: professional services agency
An agency usually lives and dies on a few things. Revenue quality. Utilization. Payroll pressure. Collections.
If I'm reviewing an agency report, I want to know whether growth is creating cash or just creating more work.
Here's a simple month-end dashboard format.
Sample KPI Dashboard: Professional Services Agency (Month-End)
| KPI | Current Month | Prior Month | Target | Note |
|---|---|---|---|---|
| Revenue | Up | Flat | On plan | Growth came from one large client expansion |
| Gross margin | Slightly down | Higher | Needs review | More contractor use reduced margin |
| Payroll as % of revenue | Up | Lower | Watch closely | Hiring happened before full revenue ramp |
| DSO | Higher | Lower | Improve | Slower collections are delaying cash receipts |
| Operating cash flow | Down | Up | Stabilize | Profit did not convert cleanly into cash |
| Revenue per employee | Flat | Flat | Improve | Team capacity may be underused |
That table is useful, but the comments make it actionable. A short narrative might read like this:
Revenue increased, but the gain was less healthy than it first appeared. Contractor spend rose faster than expected, which squeezed margin. At the same time, receivables aged, so cash did not keep pace with sales. Next step: review project pricing, tighten invoice follow-up, and confirm that staffing levels match current delivery demand.
That's what owners need. Not just “revenue up.” They need the story behind it.
A lot of these issues start with reporting habits that look harmless at first, like weak cutoff procedures, unclear expense classification, or delayed invoicing. If you want a practical refresher on common accounting mistakes to avoid, that guide is useful because it shows how small reporting errors can distort owner decisions.
Example two: construction contractor
A contractor's report should not look like an agency's report. Generic CFO content usually fails in this regard.
For a contractor, the owner typically needs fast visibility into gross margin by job, work in progress, billing pace, collections, and cash pressure. A standard monthly P&L won't show that clearly enough.
A useful contractor summary might include:
- Revenue by active job: Which projects are carrying the month
- Gross margin per job: Whether the work is profitable
- Work in progress review: Whether earned revenue, billed revenue, and cost recognition line up
- Receivables aging by customer or project: Which jobs are tying up cash
- Cash outlook: Whether upcoming payroll and vendor payments create a squeeze
A short contractor commentary might say:
One large project drove this month's revenue, but its margin ran below the rest of the book. That may point to an estimating issue, change-order leakage, or field labor overruns. Billing is moving, but collections are slower than the pace of costs, so cash is tighter than the income statement suggests.
That one paragraph can change how the owner bids the next job.
Example three: dental practice
A dental owner usually cares less about capital markets language and more about chair utilization, hygiene production, payroll, supply spend, and owner take-home cash.
A solid practice report often connects:
- Production trends
- Collection trends
- Payroll pressure
- Supply costs
- Operating cash needs
If payroll rises while collections lag, the owner needs to know now, not after quarter-end. If hygiene is strong but doctor production softens, staffing and schedule decisions may need to change.
The best cfo report example for a dental office is simple enough to read between patients and strong enough to support real decisions.
Choosing the KPIs That Actually Matter
Some CFO dashboards cover a long list of metrics. NetSuite says a modern CFO dashboard can include 40 KPIs, but that doesn't mean your monthly owner report should try to show all of them. The same source notes that only 18% of finance teams complete month-end close in three days or less, half still take longer than five business days, and 76% of CFOs identify streamlining accounting and finance processes as a top priority for 2025. NetSuite also says automation can reduce consolidation workload by 50% each close cycle, which is why concise reporting usually beats bloated reporting for SMB decision-making (NetSuite CFO KPI overview).
That's the trade-off. More data isn't the same as more clarity.
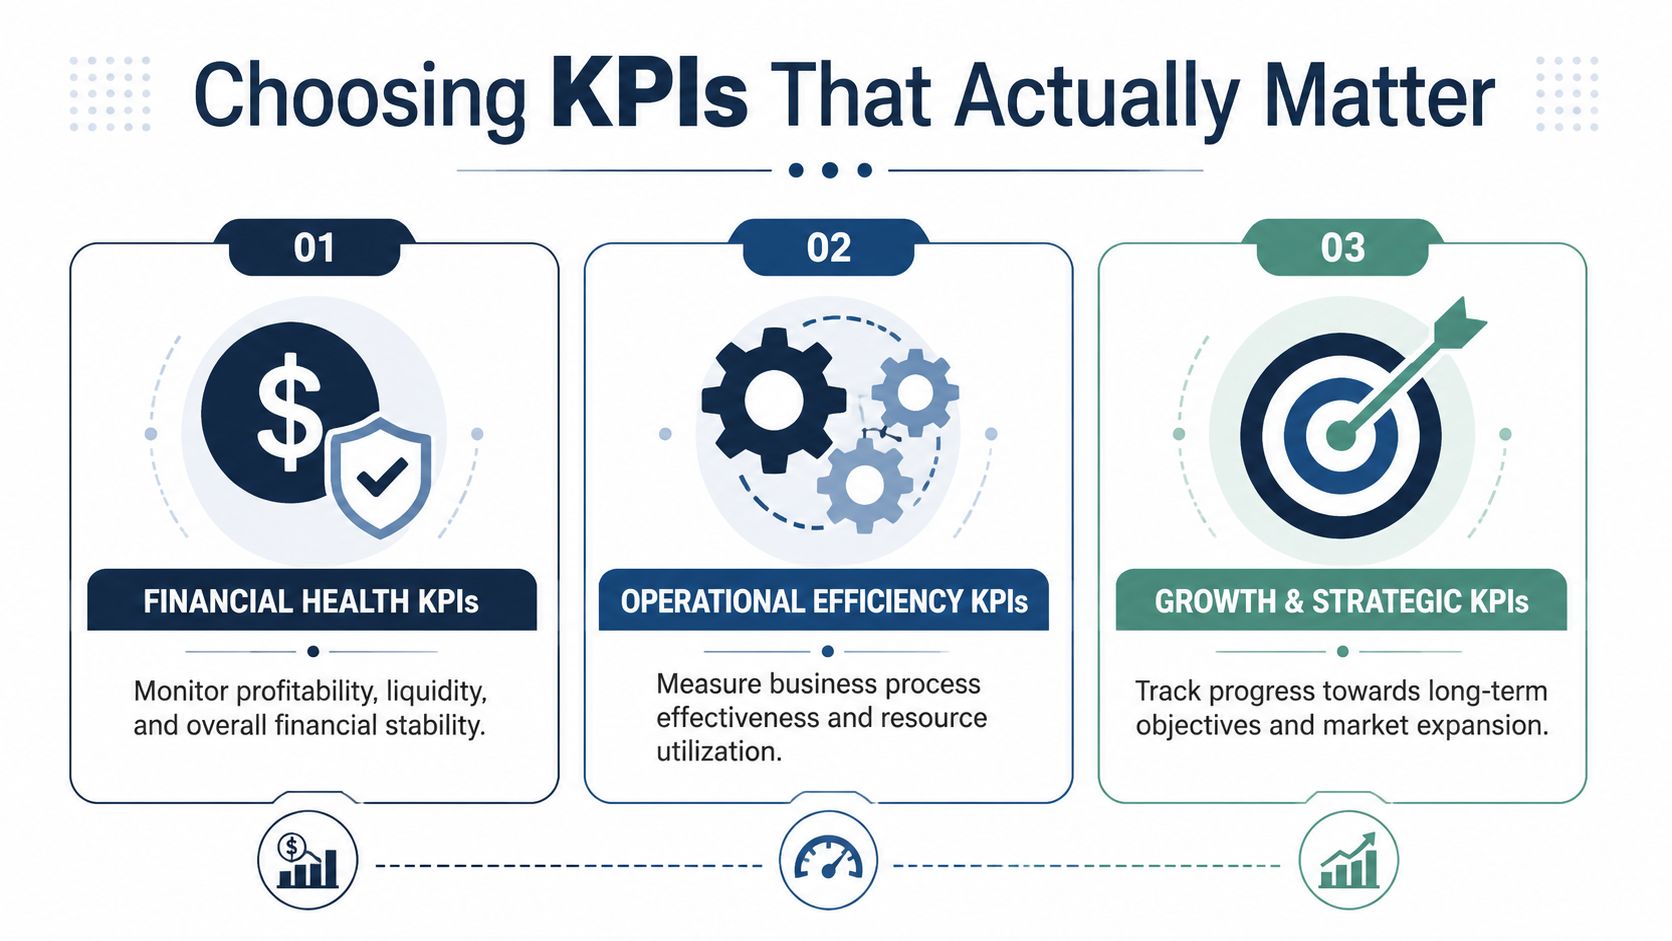
Profitability KPIs
Start with the question every owner asks, even if they phrase it differently: Are we making enough money on the work we do?
Use a few metrics that answer that directly.
- Revenue growth: Helpful for direction, but not enough on its own
- Gross margin: Tells you whether delivery costs are eating the sale
- EBITDA: Oracle defines it as net income + interest + taxes + depreciation + amortization, which helps separate operating performance from financing and accounting noise
- Net profit trend: The plain-language view of what's left after everything else
If sales are rising while margin is slipping, that's a warning sign. Growth can hide a lot of bad habits for a while.
Liquidity KPIs
Profit doesn't pay payroll. Cash does.
This group tells you whether the business can handle near-term obligations without stress.
A few useful ones:
- Operating cash flow
- Working capital
- Quick ratio
- Cash runway
Think of liquidity like the amount of breathing room in the business. If cash gets tight, good months on paper stop feeling good in real life.
A business can be profitable and still feel broke. That usually shows up in the liquidity section before it shows up anywhere else.
For owners building a simpler dashboard, this small business KPI guide is a practical starting point because it keeps the focus on usable metrics instead of report clutter.
Efficiency and risk KPIs
This category answers a different question. How well is the business operating, and where are the hidden weak spots?
Useful examples include:
- DSO: How long it takes to collect after invoicing
- Accounts receivable turnover
- Accounts payable turnover
- Cash conversion cycle
And don't stop at standard finance ratios. Many owners also need a risk view in the same report. If that's a gap in your current package, a good guide to key risk indicators can help you think through what belongs in that section.
For a contractor, that may include customer concentration and insurance exposure. For an agency, it may include dependence on one client or too much payroll tied to a single service line. For a dental office, it may include provider dependence or a weak collections trend.
Turning Your CFO Report Into Smart Decisions
A report only helps if somebody uses it while there's still time to act.
The easiest way to make this work is to build a simple monthly rhythm. Same report. Same review process. Same decision questions every month.
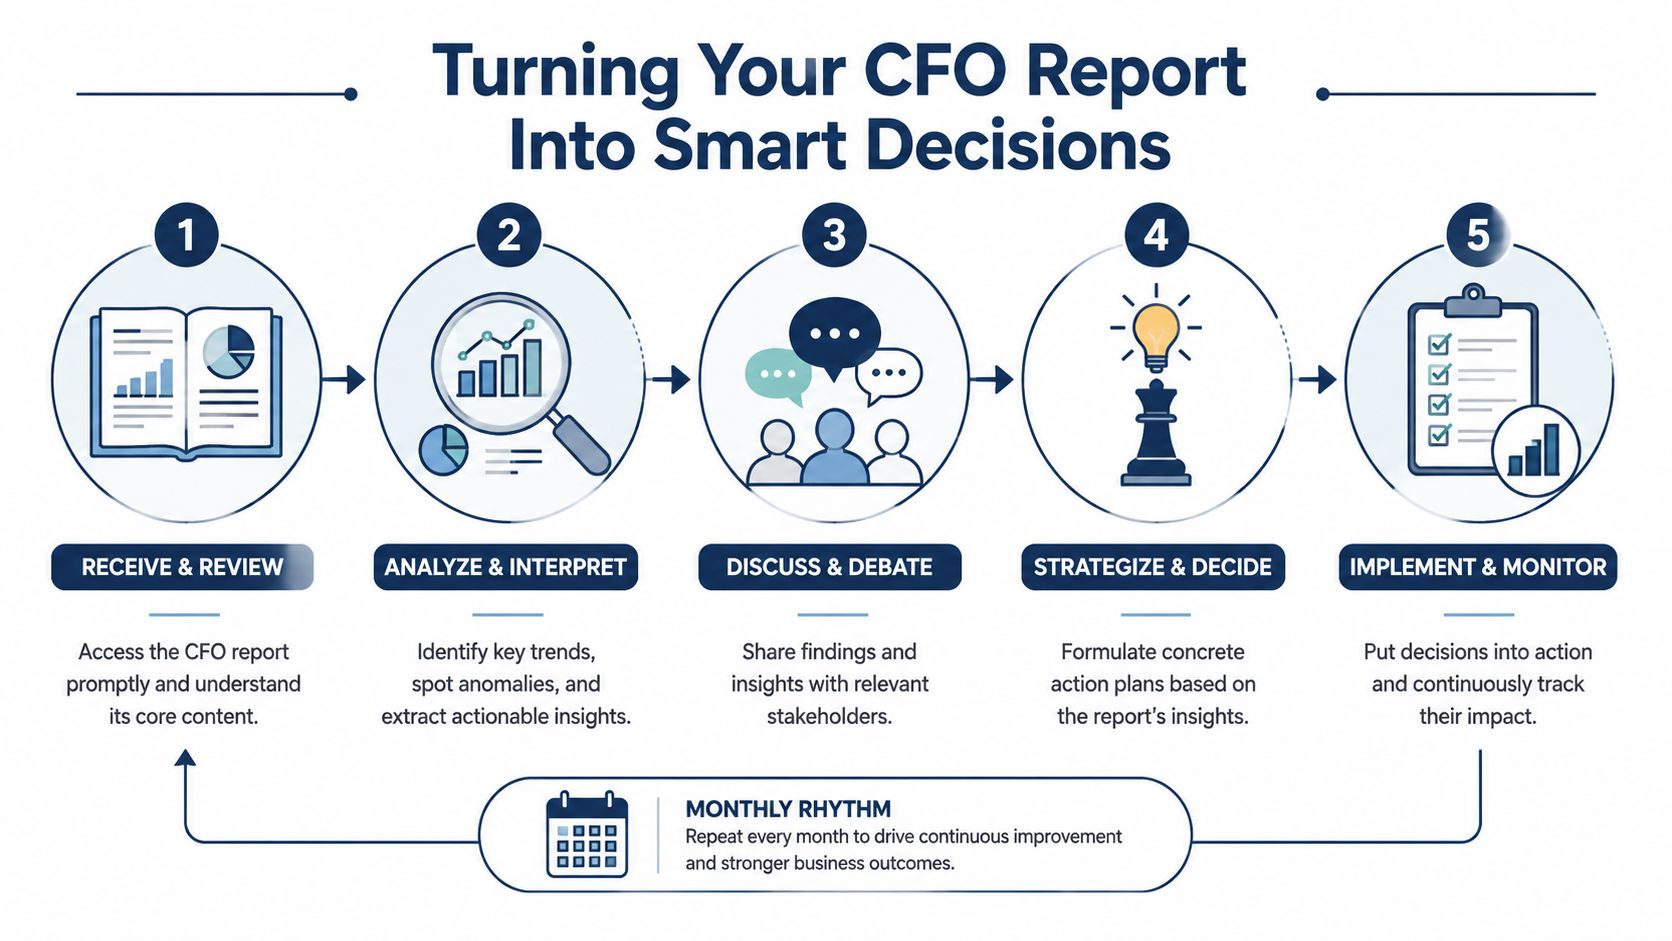
Start with the changes
Look at what moved since the last reporting period.
Don't scan every line. Look for the items that changed enough to matter. Revenue, gross margin, payroll, collections, cash, and debt pressure usually tell you where to start.
Then ask the basic follow-up questions:
- What changed?
- Why did it change?
- Is it temporary or part of a trend?
- What action does this require?
That last question is the one owners skip when they're busy.
Compare against real thresholds
Raw numbers are hard to interpret by themselves. Benchmarks make them useful.
One benchmark-focused source notes that a current ratio of 1.5 to 2.0 is generally healthy, while below 1.2 can be a warning sign. The same source says DSO of 30 to 45 days is typical, and above 60 days often signals collection trouble. It also gives EBITDA margin of 10% to 20% for mature SMB services, with below 8% as a weakness signal (John Galt Finance on CFO reporting benchmarks).
Those aren't universal laws. Industry and business model matter. But they're useful because they force better conversations.
If your DSO is climbing past the healthy range, the action might be tighter invoice timing, faster follow-up, cleaner payment terms, or requiring deposits on certain work.
If your current ratio is slipping, you may need to slow spending, renegotiate payment timing, or build a more disciplined cash forecast.
Turn commentary into decisions
A useful review meeting ends with owners assigning actions, not just nodding at charts.
Here's what that often looks like in practice:
| Report finding | Likely business decision |
|---|---|
| Margin is shrinking | Review pricing, labor mix, or vendor costs |
| DSO is rising | Tighten collections and invoice discipline |
| Payroll is rising faster than revenue | Pause hiring or revisit utilization |
| Cash is getting tight | Build weekly cash planning and delay nonessential spend |
| One client or project dominates revenue | Reduce concentration risk over time |
Don't ask whether the report is interesting. Ask whether it changed a decision.
This is also the point where outside support can help. Some businesses use internal finance staff, some use their CPA for periodic review, and some use an outsourced advisory team. For example, MyOfficeOps provides bookkeeping, financial analytics, forecasting, and CFO-level reporting support for SMBs that need cleaner numbers and clearer monthly decision notes.
From Data Overload to Financial Clarity
A good cfo report example isn't fancy. It's useful.
It helps you stop staring at disconnected reports and start seeing the business as a whole. What's making money. What's draining cash. What's improving. What needs attention before it becomes a problem.
For a small or midsize business, that kind of clarity matters more than another spreadsheet ever will. It's how you make hiring decisions with less stress. It's how you catch margin problems before they turn into a bad quarter. It's how you stop confusing activity with progress.
The strongest reports also go beyond historical numbers. They include a basic risk view. That can mean customer concentration, liquidity runway, or insurance exposure. Modern CFO reporting should address those risk areas because businesses often have protection gaps, meaning they either lack needed insurance or carry limits that may be too low to absorb losses. When that kind of risk shows up inside the report, the owner can deal with it before it becomes expensive (biBerk on avoiding business insurance coverage gaps).
If you want faster reporting without chasing spreadsheets all month, it also helps to improve the process behind the report. Better systems and financial reporting automation can make the reporting cycle more consistent and easier to trust.
The win is simple. You stop guessing. You start deciding with context.
If you want help building a CFO report that works for your business, MyOfficeOps can help you turn bookkeeping data into clear monthly reporting, practical KPI dashboards, and decision-ready advice for cash flow, hiring, pricing, and profitability.