Running a small business is like juggling a dozen things at once. You’re always thinking about your customers, your projects, your team, and the next big sale. But how do you know if all that hard work is actually paying off? A lot of owners just look at their bank account. If there's money in there, things must be good, right?
Not quite. That one number doesn't tell you if your services are really making money, if your marketing is bringing in good clients, or if you might run out of cash next month.
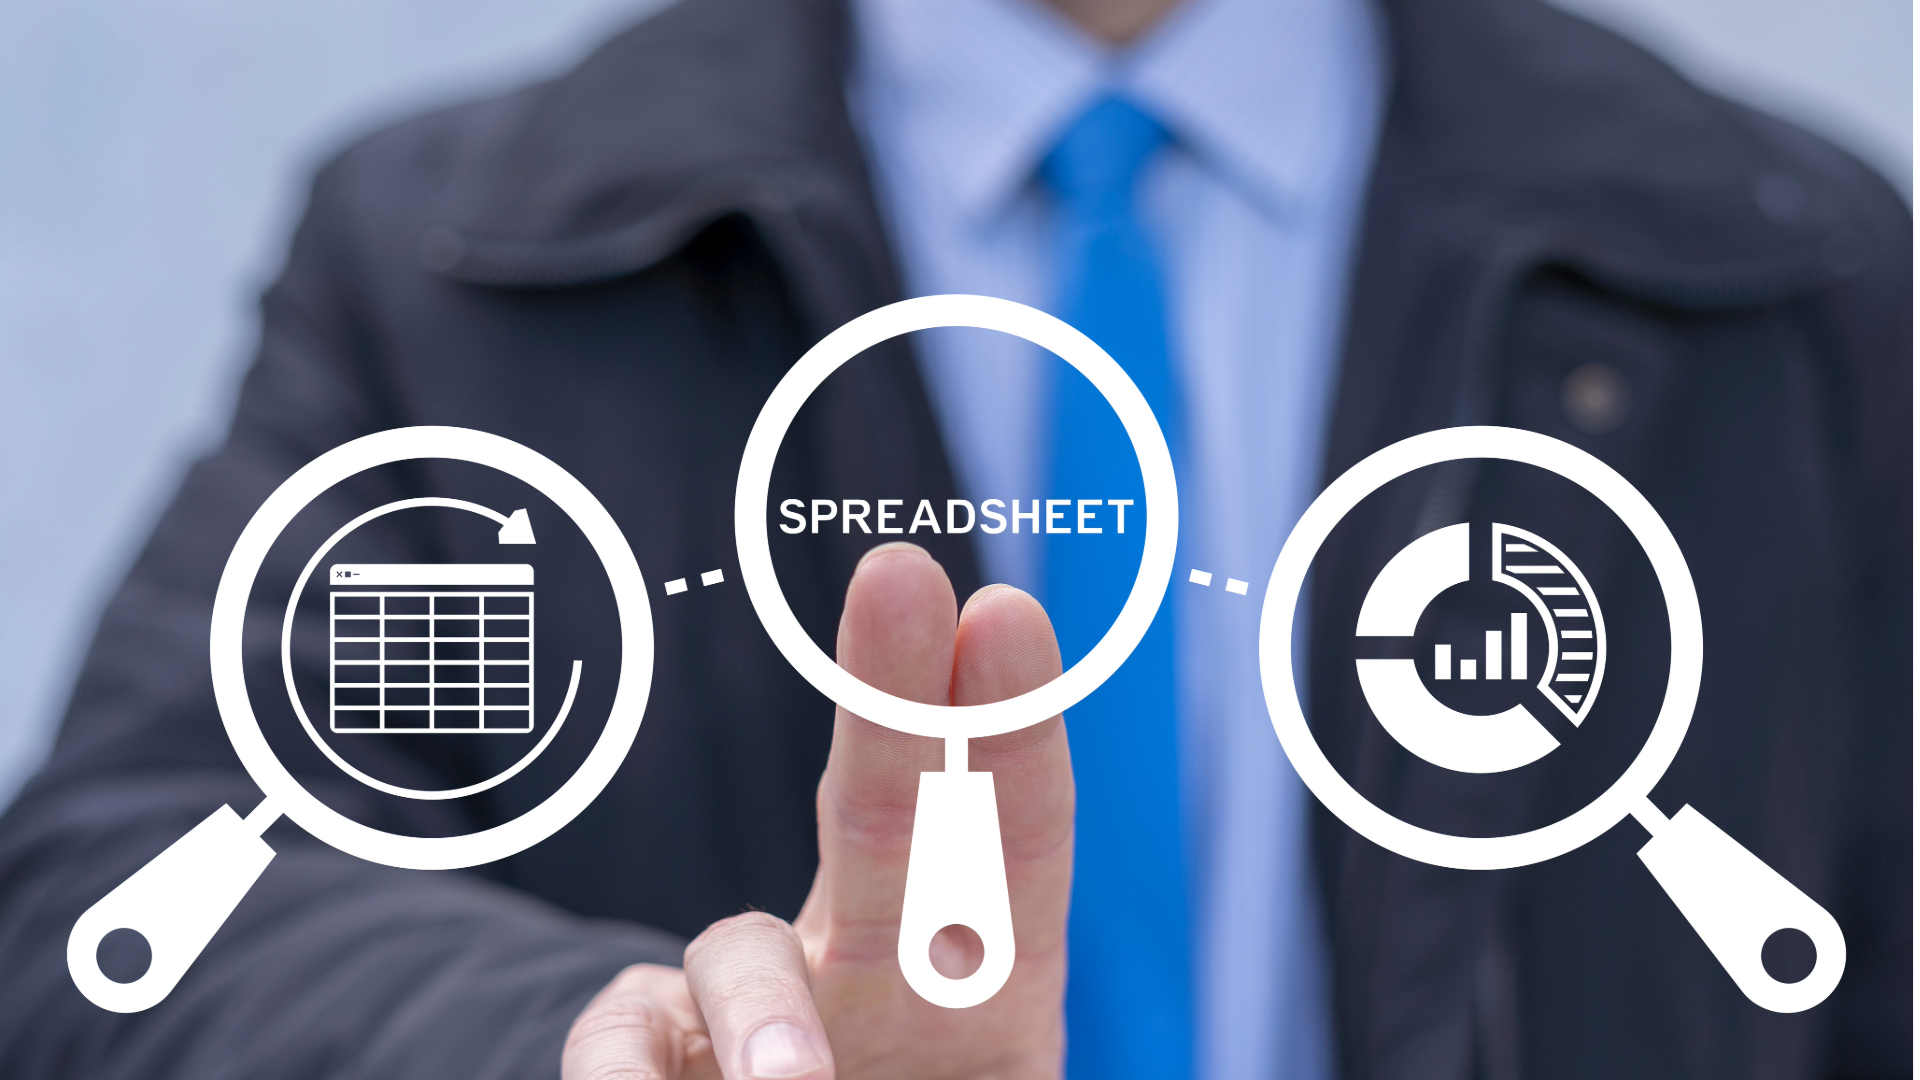
Think of Key Performance Indicators (KPIs) like the dashboard in your car. You wouldn't drive across the country by just looking at the gas gauge. You need to know your speed, if the engine is getting too hot, and if you're low on oil. KPIs are that dashboard for your business. They are specific numbers that tell a clear story about what’s working and what’s not.
In this guide, we’ll talk about the 10 most important key performance indicators for small business. We'll skip the fancy words and give you simple explanations of what each number means, how to figure it out, and what you can do with that information. Let's help you stop guessing and start making smarter choices that help your business grow.
1. Gross Profit Margin
Gross Profit Margin is a basic health check for your business. It tells you how much money is left from your sales after you pay for the direct costs of making your product or doing your service. These direct costs are called the Cost of Goods Sold (COGS). Think of it as the profit you make from what you sell before paying for things like rent, marketing, or office salaries. This is one of the most important key performance indicators for a small business because it shows if the things you sell are profitable on their own.
A high Gross Profit Margin means you have extra money to cover all your other bills and still have some left over. A low margin is a warning sign that you might need to change your prices or lower your costs.
Why It Matters and How to Calculate It
This number tells you if your prices are right and if you're keeping your direct costs in check. For example, if you're a builder, it shows if you managed the cost of wood and labor for a specific job well. If you run a design agency, you can see which types of projects make you the most money.
- Formula: (Total Sales – Cost of Goods Sold) / Total Sales x 100
- Example: Your consulting firm makes $100,000 in sales. You spend $45,000 on salaries for the consultants and software they need for the projects (your COGS). Your Gross Profit Margin is ($100,000 – $45,000) / $100,000 x 100 = 55%.
Actionable Tips for Improvement
Knowing your Gross Profit Margin is only half the battle. You have to use it to make better decisions.
- Check your costs monthly: See if the price of materials or labor is going up before it hurts your profits.
- Track by project or service: Figure out the margin for each job or service you offer. You might find that your kitchen remodels are way more profitable than your bathroom jobs.
- Adjust your pricing: Once you know your margin, you can price your services better. Check out some effective price increase strategies that won't scare off your customers.
By watching this number, you can guide your business to make more money. For more ideas, learn about improving your Gross Profit Margin.
2. Net Profit Margin
If Gross Profit Margin tells you if your services are profitable, Net Profit Margin tells you if your entire business is profitable. It measures how much money is left after you pay for all your expenses. This includes the direct costs (COGS) plus all your operating costs, like rent, marketing, loan payments, and taxes. This is your "bottom line," the final score that shows how much money your business really made.
A positive Net Profit Margin means your business is healthy and you're managing all your costs well. A low or negative number means that even if you're making money on each sale, your other expenses are eating up all your profits. This is a vital key performance indicator because it answers the big question: "Is my business actually making money?"
Why It Matters and How to Calculate It
This number is the final report card for your business's financial health. It shows how well you control your day-to-day costs. For an IT company, a better net profit margin might come from cutting down on unnecessary software subscriptions. For a dentist's office, it might mean scheduling patients more efficiently to see more people without hiring more staff.
- Formula: (Net Income / Total Sales) x 100
- Example: A law office brings in $500,000 in sales. After paying for everything—salaries, rent, advertising, and taxes—the final profit (Net Income) is $75,000. The Net Profit Margin is ($75,000 / $500,000) x 100 = 15%.
Actionable Tips for Improvement
Watching your Net Profit Margin helps you make big decisions about where your business is going.
- Review your P&L every month: Don't wait until the end of the year. Look at your Profit and Loss statement regularly to see where your money is going.
- Find your winners: See which services or clients bring in the most net profit. This helps you focus on what's really working.
- Plan for the future: Use your Net Profit Margin to set goals. It helps you figure out how much you can afford to grow.
- Focus on your own progress: While it's good to know what other businesses in your industry are doing, your main goal should be to improve your own net margin over time.
3. Cash Flow
Cash flow is the lifeblood of your business. It’s the actual money moving in and out of your bank account. Unlike profit, which can include sales you haven't been paid for yet, cash flow is about the real cash you have on hand to pay bills, pay your team, and grow. It shows if your business can survive day-to-day.
Positive cash flow means more money is coming in than going out. That’s a great spot to be in. Negative cash flow is a big red flag. It means you might not have enough money to cover your bills, even if you’re technically profitable. Watching your cash flow is one of the most important key performance indicators for a small business because it tells you what’s really happening with your money.

Why It Matters and How to Calculate It
This number is key for managing your daily operations. A builder, for example, has to pay for supplies and workers now but might not get paid by the client for 60 days. Good cash flow management helps them survive that gap. A marketing agency can improve its cash situation just by getting clients to pay their invoices in 30 days instead of 45.
- Formula: Money Coming In – Money Going Out
- Example: Your business starts the month with $15,000. You get $50,000 from customers (money in). You spend $30,000 on payroll and rent, plus another $5,000 on a loan payment (money out). Your Net Cash Flow for the month is $50,000 – ($30,000 + $5,000) = $15,000.
Actionable Tips for Improvement
Don't just watch your cash flow; manage it.
- Look ahead: Create a simple cash flow forecast for the next few weeks or months. This helps you see problems before they happen.
- Get paid faster: Send invoices right away. You could even offer a small discount for customers who pay early.
- Talk to your suppliers: See if you can get more time to pay your bills (like 45 days instead of 30). This keeps cash in your account longer.
- See how fast your cash moves: Track how long it takes from the moment you spend money on a project to the moment you get paid for it. The shorter, the better.
Managing your cash flow helps you avoid nasty surprises and keeps your business stable. To make it easier, you can grab our free cash flow forecasting template.
4. Cash Conversion Cycle (CCC)
The Cash Conversion Cycle (CCC) sounds complicated, but it's pretty simple. It measures how many days it takes for your company to turn the money it spends on a project into cash in the bank. Basically, it’s the time between when you pay for supplies and labor and when your customer pays you. This is one of the most important key performance indicators for a small business because it shows how efficiently you use your cash.
A short cycle is great. It means your money isn't tied up for long. A long cycle is a warning sign. It means your cash is stuck in unpaid invoices or materials sitting on a shelf, which can make it hard to pay your own bills, even if you have a lot of work. This is a huge deal for builders and other service businesses where you have to spend money long before you get paid.
Why It Matters and How to Calculate It
This number gives you a big-picture view of how you manage your projects, your bills, and the money owed to you. For a company that makes things, it can show if they have too much product sitting around. For a construction company, a long CCC might mean you’re paying your subcontractors weeks before the client pays you, which creates a cash squeeze.
- Formula: Days to Sell Inventory + Days to Collect Invoices – Days You Take to Pay Your Bills
- Example: A contractor holds materials for 30 days before using them. It takes 60 days to get paid by clients. The contractor pays its own suppliers in 45 days. The CCC is 30 + 60 – 45 = 45 days. This means the business’s cash is tied up for 45 days on every project.
Actionable Tips for Improvement
Your goal is to make your CCC as short as possible.
- Look at each part: Check the three parts of the formula separately. Is your cash stuck because you have too much inventory? Are customers paying you too slowly? Or are you paying your own bills too fast?
- Bill and collect faster: Send invoices the second a job is done. This shortens the time it takes to get paid.
- Negotiate better terms: If clients usually pay you in 60 days, try to get similar terms from your own suppliers. This helps line up when money comes in with when it goes out.
5. Return on Investment (ROI)
Return on Investment (ROI) is like a report card for any money you spend on your business. It tells you how much profit you made from a specific investment. Whether you're buying a new piece of equipment, starting an ad campaign, or hiring a new salesperson, ROI tells you if it was a good use of your money. For a small business owner with limited cash, it's one of the most important key performance indicators for small business.
A high ROI means your decision paid off, and you should probably do more of that. A low or negative ROI is a clear sign to stop what you're doing and try something else. It helps you stop making decisions based on feelings and start using real numbers.
Why It Matters and How to Calculate It
This number is key for deciding where to put your money. A doctor's office can use it to figure out if buying a new X-ray machine will actually make them more money. A construction company can use it to see if hiring a project manager really saves them enough money on delays to be worth the salary.
- Formula: (Profit from Investment – Cost of Investment) / Cost of Investment x 100
- Example: A marketing agency spends $10,000 on a new ad campaign. That campaign brings in $30,000 of profit. The ROI is ($30,000 – $10,000) / $10,000 x 100 = 200%. For every dollar they spent, they got two dollars back in profit.
Actionable Tips for Improvement
ROI helps make sure every dollar you spend is working for you.
- Set a timeline: Decide how long you expect an investment to pay off. A new computer might pay for itself over 3 years, but an ad campaign should show results in a few months.
- Have a minimum goal: Decide on a minimum ROI you need to see before you make an investment. A risky new idea should have a much higher expected ROI than a simple equipment upgrade.
- Check your work: After you make an investment, go back and see if your actual ROI matched what you predicted. This helps you get better at guessing in the future.
6. Revenue Per Employee
Revenue Per Employee is a simple but powerful number. It tells you how much money each employee brings into the business. It's a great way to see how efficient your team is. For businesses that sell services—like IT firms, law offices, or doctor's offices—where people are your biggest cost, this is one of the most telling key performance indicators for a small business. It helps you figure out if you have the right number of people on your team.
A high Revenue Per Employee suggests your team is productive. A low number could mean you have too many people for the amount of work you have, or that your team isn't being used in the best way.
Why It Matters and How to Calculate It
This number helps you make smart decisions about hiring. For an IT company, it can show if a new sales strategy is helping each consultant bring in more money. For a law firm, it can show that hiring a paralegal to handle paperwork frees up the lawyers to do more high-value work, increasing the revenue each lawyer generates.
- Formula: Total Yearly Sales / Total Number of Employees
- Example: A doctor's office has $2,100,000 in yearly sales and 6 doctors. The Revenue Per Employee is $2,100,000 / 6 = $350,000. They make a few changes to their office process, and sales grow to $2,520,000 with the same staff. Now the metric is $420,000.
Actionable Tips for Improvement
This number is all about getting the most out of your team.
- Track by role: It can be helpful to calculate this separately for the people who do the client work (like consultants) and the people who support them (like office managers).
- Check it quarterly: Look at this number every three months to spot any problems before they get too big.
- Use it for hiring: Before you hire someone new, use this number to ask, "Can this new person help us bring in enough new sales to be worth their salary?"
7. Accounts Receivable Days (DSO – Days Sales Outstanding)
Accounts Receivable Days, often called Days Sales Outstanding (DSO), measures how many days, on average, it takes you to get paid after you make a sale. Think of it as your company's "collection speed." A low number is good—it means cash is coming in fast. A high number means customers are taking a long time to pay you, which can hurt your cash flow. This is one of the most important key performance indicators for a small business, especially if you send invoices for your work.
A low DSO means you have a good system for billing and collecting money. A rising DSO is a warning sign that something is wrong. Maybe your invoices are confusing, your payment terms aren't clear, or your customers are having financial trouble.
Why It Matters and How to Calculate It
This number has a direct effect on how much cash you have. For a marketing agency, a high DSO could mean they have to use a credit card to make payroll. For a builder, a single slow-paying client could put the whole company's finances at risk if their DSO gets too high.
- Formula: (Total Unpaid Invoices / Total Sales) x Number of Days in the Period
- Example: Your IT company has $75,000 in unpaid invoices (Accounts Receivable). Over the last 90 days, you had $300,000 in sales. Your DSO is ($75,000 / $300,000) x 90 = 22.5 days. On average, it takes you about 23 days to get paid.
Actionable Tips for Improvement
Knowing your DSO is the first step. The next is to get that number down.
- Invoice right away: Don't wait. Send invoices as soon as the work is done.
- Be clear about payment: Make sure your contracts clearly state when payment is due and if there are any late fees.
- Offer a discount for early payment: A small 1-2% discount for paying within 10 days can get you your cash much faster.
- Follow up: Don't be afraid to send a friendly reminder a few days after an invoice is due.
- See who is late: Run a report to see which customers are always paying late. You can use an accounts receivable aging report template to see this clearly.
By working to lower your DSO, you take control of your cash flow.
8. Operating Expense Ratio
If Gross Profit Margin shows if your services are profitable, the Operating Expense Ratio (OER) shows how efficient you are at running the business itself. It measures how much of every dollar you earn goes toward paying for overhead—things like rent, office staff salaries, and marketing. Think of it as the cost of keeping the lights on. This is one of the most useful key performance indicators for a small business because it affects your final profit.
A low OER is a sign that you run a tight ship. It means more of your sales turn into profit. A high OER can mean your business has too many extra costs that are eating away at your profits.
Why It Matters and How to Calculate It
This number is key for controlling your overhead costs. For a doctor's office, it might show that the cost of their administrative staff is much higher than for similar practices. For a construction company, it helps them keep track of all the business costs that aren't tied directly to a specific job.
- Formula: (Total Operating Expenses / Total Sales) x 100
- Example: Your marketing agency has $500,000 in sales and spends $225,000 on operating expenses (rent, admin salaries, software). Your Operating Expense Ratio is ($225,000 / $500,000) x 100 = 45%. This means 45 cents of every dollar you earn goes to running the business.
Actionable Tips for Improvement
Watching your OER helps you run a more profitable business.
- Break down your costs: Look at your expenses by category, like rent, software, and marketing. This helps you see where your money is really going.
- See how you compare: Find out what the average OER is for businesses in your industry. If your costs are much higher, you know where to focus.
- Automate or outsource: See if there are tasks you can use software for or hire an outside company to do. For example, a consulting firm could save money by outsourcing its bookkeeping instead of hiring a full-time person.
9. Customer Acquisition Cost (CAC)
Customer Acquisition Cost (CAC) tells you exactly how much money you spend to get one new customer. It includes all your sales and marketing costs—from ads to salaries—and divides that by the number of new customers you got. This is a big deal because if it costs you more to get a customer than you'll ever make from them, you have a problem. This is one of the most important key performance indicators for a small business that wants to grow.
A low CAC means your marketing is working well. A high CAC is a red flag. It might mean your ads aren't working or you're spending money in the wrong places. Watching this number helps you spend your marketing budget wisely.

Why It Matters and How to Calculate It
This number helps you figure out if your marketing is worth the money. A consulting firm might find that getting a client through LinkedIn ads costs them $8,000, but a client from a referral only costs them $1,000. That tells them to focus more on getting referrals.
- Formula: (Total Sales & Marketing Costs) / Number of New Customers
- Example: Your IT firm spends $15,000 on marketing and sales in one quarter and gets 10 new clients. Your CAC is $15,000 / 10 = $1,500 per client.
Actionable Tips for Improvement
Knowing your CAC is good. Using it to make changes is better.
- Track by channel: Don't just figure out one CAC for your whole business. Look at the cost for each marketing channel, like Google Ads, referrals, or trade shows.
- Compare CAC to what a customer is worth: A good rule of thumb is that a customer should be worth at least three times what it costs you to get them.
- Include all the costs: Make sure you count everything—ad costs, salaries for your sales team, marketing software, and anything else related to getting new customers.
10. Customer Lifetime Value (CLV)
Customer Lifetime Value (CLV) is the total amount of profit you can expect to make from a single customer over time. Instead of just looking at one sale, CLV helps you see the long-term value of keeping a customer happy. This is one of the most powerful key performance indicators for a small business because it helps you focus on building lasting relationships, not just making quick sales.
A high CLV means your customers are loyal and keep coming back. A low CLV could mean customers aren't happy or you're not giving them a reason to stay. It tells you if the cost of getting a customer is worth it in the long run.
Why It Matters and How to Calculate It
This number helps you make big decisions about where to spend your time and money. An IT firm might realize that clients who pay a monthly fee are four times more valuable over their lifetime than clients who just hire them for one-off projects. This could make them change their whole business model.
- Formula: (Average Profit from a Customer Per Year × Average Number of Years They Stay a Customer)
- Example: A marketing agency finds that the average client stays for 3 years and brings in a profit of $15,000 each year. The CLV is $15,000 x 3 = $45,000. Knowing a client is worth this much makes it easy to decide to spend a little extra to keep them happy.
Actionable Tips for Improvement
CLV is a guide for how to grow your business smartly.
- Group your customers: Figure out the CLV for different types of customers. You might find that customers from a certain industry are far more valuable than others.
- Focus on your best customers: Give your best service to the customers who are worth the most to you over time.
- Sell more to existing customers: Look for ways to offer more value to the customers you already have. This is often easier and cheaper than finding new ones.
- Watch for changes: If your CLV starts to drop, it could be an early sign that customers are getting unhappy or a new competitor is in town.
Top 10 Small Business KPI Comparison
| Metric | 🔄 How Hard to Set Up | ⚡ What You Need | ⭐ What You Get | 📊 Best For | 💡 Main Benefit |
|---|---|---|---|---|---|
| Gross Profit Margin | Easy — simple math | Low — sales & direct cost numbers | High — tells you if your product/service is profitable | Pricing, cost control | Quick check on profitability |
| Net Profit Margin | Medium — need all your expenses | Medium — full financial records | Very high — shows if your business is truly making money | Big picture planning, talking to banks | The final word on how profitable you are |
| Cash Flow | Medium–Hard — needs careful tracking | Medium — bank records, invoices, bills | Very high — shows if you can pay your bills and survive | Day-to-day money management, planning for big costs | Tells you your real cash situation |
| Cash Conversion Cycle (CCC) | Medium — combines a few numbers | Medium — need accurate invoice and bill data | High — helps you free up cash | Businesses that hold inventory or have long payment times | Improves your cash without needing more sales |
| Return on Investment (ROI) | Easy–Medium — track one expense and its result | Low–Medium — cost and profit from one project | Medium–High — helps you decide where to spend money | Big purchases, hiring, new marketing | Simple way to compare different spending options |
| Revenue Per Employee | Easy — simple division | Low — sales and staff numbers | Medium — shows how productive your team is | Staffing decisions, service businesses | Easy way to see if hiring is paying off |
| Accounts Receivable Days (DSO) | Easy — simple math | Low — unpaid invoices and sales data | High — helps you get paid faster | Improving collections, fixing invoicing | Direct way to get more cash in the bank |
| Operating Expense Ratio | Easy — needs organized expenses | Low — expense and sales numbers | High — shows where your overhead is too high | Cutting costs, making your business more efficient | Finds "bloat" in your budget |
| Customer Acquisition Cost (CAC) | Medium–Hard — needs good tracking | High — marketing and sales data | High — makes your marketing spending smarter | Choosing where to advertise, planning for growth | Stops you from wasting money on marketing |
| Customer Lifetime Value (CLV) | Medium–Hard — needs customer history | Medium — customer sales data | High — helps you focus on long-term profit | Keeping customers happy, pricing | Shows you the value of good customer service |
Turn Your Numbers Into Action
We've just gone through ten key numbers for small business owners. From Gross Profit Margin to Customer Lifetime Value (CLV), each one gives you a different look into how your business is doing. It might seem like a lot, but here's the main idea: these aren't just numbers for your accountant. They are the vital signs of your business.
Think of it like a checkup at the doctor. The doctor doesn't just check one thing. They look at your blood pressure, heart rate, and cholesterol together to get a full picture of your health. In the same way, just looking at your sales can be tricky. High sales look great, but if your Net Profit Margin is almost zero and your Cash Flow is negative, your business is in trouble.
The real power comes from watching these numbers together, over time. They tell a story about where your business has been, where it is now, and where it’s going.
From Numbers on a Page to Smart Decisions
Knowing these numbers is step one. The magic happens when you start using them to make better, faster decisions.
- Is your Gross Profit Margin on one service lower than the others? That's a sign telling you to look at your pricing for that service or figure out why it costs so much to deliver.
- Is your Customer Acquisition Cost (CAC) going up? It might be time to look at your marketing and put more money into what works best.
- Are your Accounts Receivable Days getting longer? That’s a clear signal to get tougher on your collections before you have a cash flow problem.
These aren't just numbers on a spreadsheet; they are road signs telling you exactly where to focus your energy to make your business stronger. Without them, you're driving blind.
Making Data Simple
Let's be real. As a business owner, you're already busy. The last thing you want to do is spend hours digging through reports and doing math. The numbers can feel overwhelming.
That’s why it’s so helpful to turn this data into simple charts and graphs. The goal isn't to stare at numbers, but to create clear dashboards that drive decisions and give you the story at a glance. Seeing your cash flow as a simple line on a graph is much more powerful than finding a number buried in a report.
Key Takeaway: Tracking your numbers consistently is what connects information to action. These numbers are only helpful if you look at them regularly and use them to guide your choices.
In the end, understanding the key performance indicators for your small business is about taking control. It’s about swapping anxiety for clarity. It lets you get ahead of problems instead of always reacting to them. By understanding the story your numbers are telling, you can feel confident in your decisions, invest in the right places, and build a stronger, more profitable business.
Ready to stop guessing and start building a more profitable business with financial clarity? At MyOfficeOps, we transform your financial data into a simple, actionable dashboard, helping you track these KPIs and understand what they mean for your specific business. Let us handle the numbers so you can focus on what you do best.