

Tuesday morning in March, a small landscaping owner is staring at a P&L that says revenue is up, but profit barely moved. The bookkeeper is right. The numbers are accurate. They're just not answering the question that matters: did the new contract earn its keep, or did it add work without adding enough cash?
That's where cost behavior analysis helps. It separates costs that move with sales from costs that sit in place, then turns that view into a decision about pricing, hiring, or cash. You don't need a finance department to use it. You need clean activity data, a few useful formulas, and the discipline to question what the P&L is hiding.
The Moment an Owner Realizes Their Numbers Aren't Telling the Truth
The owner has a crew ready for the next job, equipment payments due, and a contract that looks impressive on the sales report. Yet the bank balance feels tighter than it did before the growth. Revenue tells him how much work came in. It doesn't tell him how much of each dollar remains after crew wages, materials, subcontractors, fuel, and other costs that rise with the work.
A regular P&L puts rent, office payroll, insurance, materials, and outside labor into the same broad picture. That's useful for reporting, but it can blur the operating decision. A new contract may carry a healthy price and still produce a thin contribution margin after the costs needed to deliver it.
The practical question: What happens to this expense when the business does one more job, serves one more patient, or bills one more hour?
Cost behavior analysis gives the owner a way to answer that question. It shows which expenses are fixed for a while, which ones change with activity, and which ones contain both parts. It also exposes the point where a business needs another truck, another technician, more office space, or a different staffing model.
A business owner who feels stuck despite higher sales may also benefit from reviewing why a business may not be making money. The issue often isn't that the books are wrong. The issue is that the books haven't been arranged around the decisions the owner has to make.
By the end of this guide, you'll have a practical way to sort costs, test the pattern, and use the result. You'll also have a simple monthly report that can tell you whether to raise a price, add a person, or protect cash before a slow stretch puts pressure on payroll.
What Cost Behavior Actually Means in Plain English
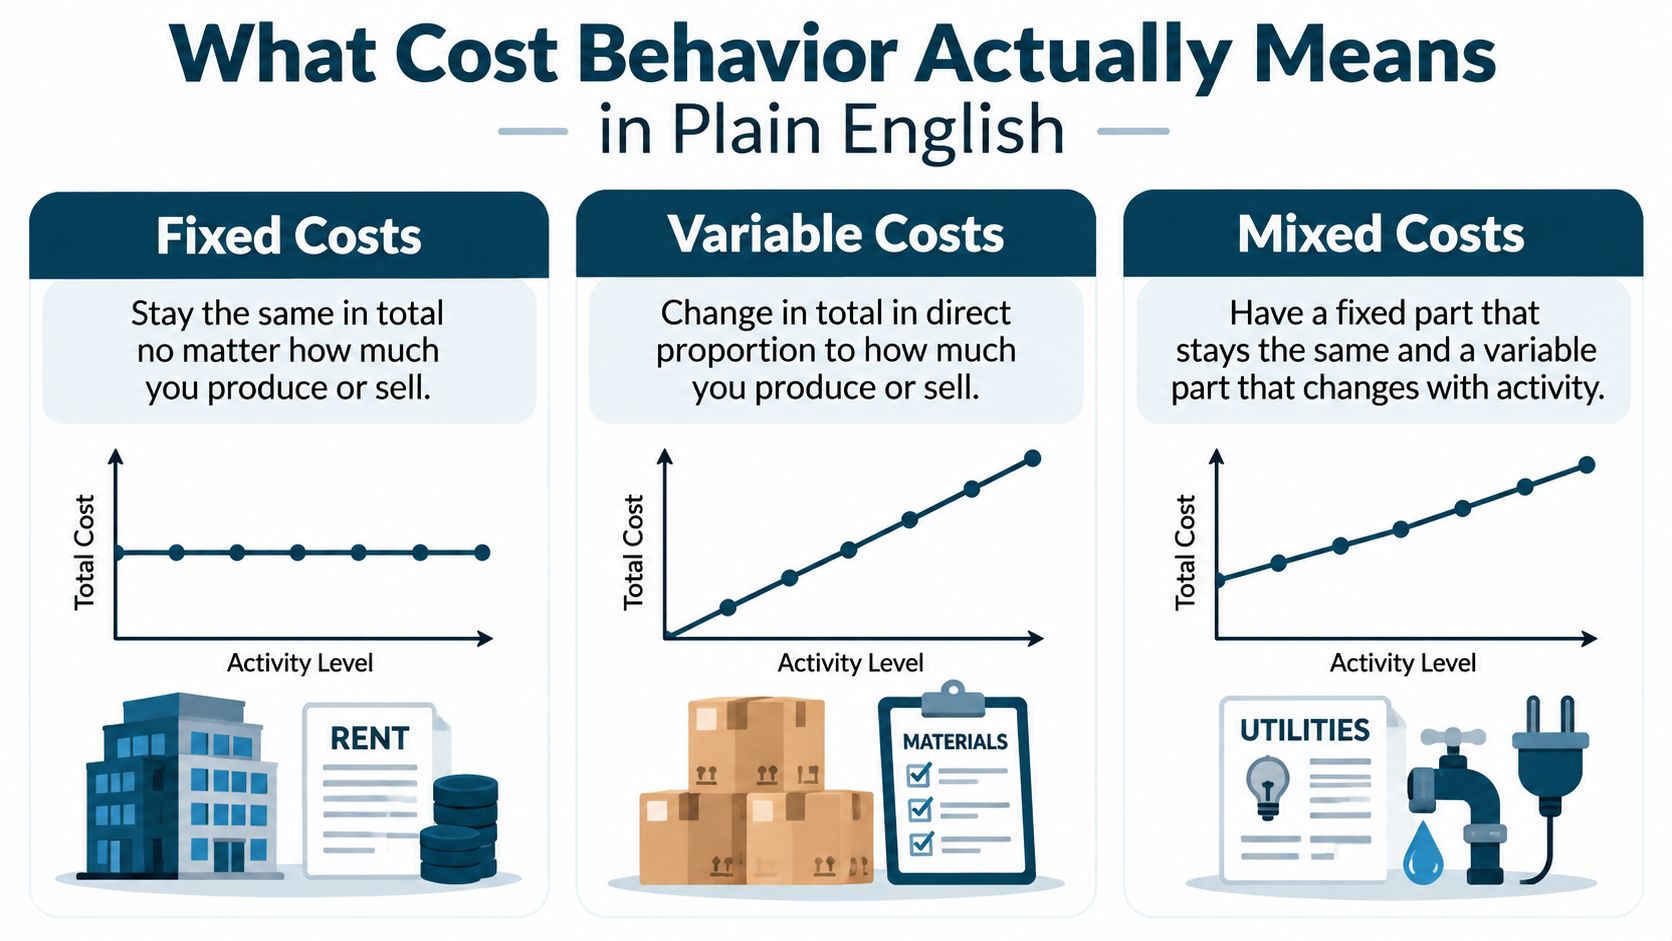
Cost behavior means how a specific expense changes when business activity changes. The activity might be units sold, visits completed, jobs finished, or hours billed. The useful question is not merely, “What did we spend?” It's, “What caused that spending to move?”
Start with three categories.
- Fixed cost: A cost that stays the same in total within a normal activity band, even when volume changes.
- Variable cost: A cost that changes with activity, usually in proportion to the work performed.
- Mixed cost: A cost that has a fixed base and a variable part tied to usage or volume.
Rent is the easiest example of a fixed cost. A shop usually pays the same rent whether it serves one customer or many. A salaried project manager may also be fixed for planning purposes, even though that person supports work across the business.
Packaging is variable. One more order generally means one more box, label, or packing insert. Subcontractor labor often behaves the same way in a construction business. More jobs require more outside crews, although the exact cost may vary by job.
A copy bill or software plan can be mixed. It may include a base fee plus charges for pages, users, storage, or usage. A phone system with a base charge and per-minute usage follows the same pattern.
Why the relevant range matters
Fixed does not mean fixed forever. It means the cost stays stable inside a relevant range, a normal band of activity. Traditional managerial accounting treats fixed costs as constant only within that band, while variable costs change in direct proportion to activity. That distinction affects contribution margin, break-even planning, pricing, and capacity decisions, as explained in this managerial accounting guide to relevant range and contribution margin.
A second location, another shift, or a larger office can push the business outside its normal range. The rent may jump. Payroll may step up. Overtime may appear. A cost that looked fixed on last year's spreadsheet can become a step cost when the operation crosses a capacity limit.
For a more detailed trade example, this CNC job shop costing breakdown is useful because job shops often need to connect labor, machine use, materials, and overhead instead of assigning every cost to one simple category.
Contribution margin is the amount left from sales after variable expenses. It first covers fixed costs, and once fixed costs are covered, additional contribution margin adds to operating profit. That's why a business can grow sales and still feel poor if the variable cost per job or visit is too high. A clean overview of the concept is available in this guide to contribution margin in accounting.
The Three Methods That Turn Cost Patterns Into Decisions
You can study cost behavior with increasing levels of effort. The right method depends on how much data you have and how expensive a wrong decision would be.
High-low for a quick first pass
The high-low method compares the highest and lowest activity points. First, subtract the lower activity from the higher activity. Then subtract the lower cost from the higher cost. Divide the cost difference by the activity difference to estimate variable cost per unit. Finally, use one period to estimate the fixed portion.
A textbook example shows costs rising from $2,020 at 340,000 gallons to $3,550 at 850,000 gallons, a cost difference of $1,530 across an activity difference of 510,000 gallons. That produces a variable cost of $3 per thousand gallons, as shown in this cost behavior analysis reference.
High-low is fast and easy to explain. It works well for a first pass, a rough quote, or a decision that doesn't justify a deeper analysis. Its weakness is that one unusual month can distort the result. A storm, shutdown, large repair, or one-time project can make the high or low point unrepresentative.
Scatter plots for a reality check
A scatter plot places every month on a graph, with activity on one axis and cost on the other. You can then look for a pattern. Do the points generally rise together? Is one month far away from the others? Does the relationship curve or change after a capacity threshold?
The graph is cheap, but it catches problems that a formula can hide. If material cost appears stable in a spreadsheet but jumps whenever jobs become more complex, the visual pattern will often make that clear. A scatter plot should sit beside the calculation, not replace it.
Regression for a stronger forecast
Least-squares regression uses a computer to find the line that best fits all the data points. It minimizes the squared distance between the actual costs and the line's predicted costs. That usually gives you a more dependable estimate than choosing two months or drawing a line by eye.
Regression becomes more useful when the business has a long history, several activity drivers, or a decision with serious financial consequences. It can also help identify asymmetric behavior, where costs rise quickly when sales increase but don't fall as quickly when sales decline. Research on this issue models changes in costs against changes in sales or activity and links the pattern to resource adjustment frictions such as hiring, layoffs, and asset commitments, as discussed in this review of sticky and anti-sticky costs.
| Method | Data Needed | Accuracy | Best For | Time to Run |
|---|---|---|---|---|
| High-low | Highest and lowest activity points | Rough | A quick estimate or early review | Short |
| Scatter plot | All available activity and cost points | Visual and directional | Finding unusual months and checking assumptions | Short |
| Least-squares regression | A consistent history of activity and cost data | Stronger when the data is clean | Forecasting and larger decisions | Longer |
A simple rule works in practice. Use high-low to get moving, use a scatter plot to challenge the result, and use regression when the pattern matters enough to justify better data work. For a deeper look at actual-versus-planned spending, review this guide to variance analysis in accounting.
Worked Examples From a Law Firm, a Dental Practice, and a Roofer
The method becomes easier once you tie it to the activity the owner already tracks. A law firm tracks billable hours. A dental practice tracks visits. A roofer tracks completed jobs. The activity driver should be close to the work that creates the cost.
A law firm
A small firm begins with monthly hours billed and total compensation for attorneys and support staff. Rent is separated as fixed. Compensation for salaried attorneys may be treated as fixed for a short planning window, while contract attorney payments may move with billed work.
The owner compares the highest and lowest billing months, then calculates:
Variable cost per billed hour = Change in activity-related compensation ÷ Change in billed hours
The result helps the firm see whether a new matter produces enough contribution margin after contract labor and other delivery costs. A firm that needs overflow support can also review options such as a law firm virtual assistant before adding a permanent role.
Next month's action: Set a minimum acceptable hourly rate based on variable delivery cost and the contribution margin needed to cover fixed overhead.
A dental practice
A two-dentist practice can compare hygiene visits with dental supplies and lab fees. Rent, core administrative payroll, and many insurance costs sit in the fixed-cost group for the planning period. Gloves, materials, lab work, and some clinical supplies move more closely with each visit.
The formula is:
Variable cost per visit = Change in supplies and lab fees ÷ Change in hygiene visits
The owner can then model a slow month by reducing visits while keeping fixed costs unchanged. That view is more useful than comparing the month's total profit with the prior month because it shows which expenses will fall when the schedule softens.
Next month's action: Review procedure pricing and appointment mix, not just the number of open slots.
A roofing contractor
A roofer tracks completed jobs against materials and subcontractor labor. Materials may vary by roof size and scope, so one job is not always one identical unit. The owner should use a consistent job category or apply separate drivers for materials, labor, and travel.
The break-even formula is:
Break-even jobs = Fixed costs ÷ Contribution margin per job
A business should not force every expense into one driver when several activities are moving the total. Modern ERP and analytics tools can identify multiple cost drivers, which is especially useful when utilization, workflow, seasonality, and job complexity all affect spending. That multi-driver issue is discussed in this overview of cost drivers and cost behavior.
Next month's action: Quote materials and subcontractor work by job type, then compare the expected contribution margin before accepting overflow work.
| Business | Activity Driver | Monthly Fixed Cost | Variable Cost per Unit | Break-Even |
|---|---|---|---|---|
| Law firm | Billed hour | Office and core payroll costs | Contract delivery cost per hour | Fixed costs ÷ margin per hour |
| Dental practice | Hygiene visit | Rent and core practice overhead | Supplies and lab cost per visit | Fixed costs ÷ margin per visit |
| Roofing contractor | Completed job | Office, equipment, and core payroll costs | Materials and subcontractor cost per job | Fixed costs ÷ margin per job |
Turning the Analysis Into Pricing, Hiring, and Cash Decisions
A cost report only earns its keep when it changes a decision. The owner should be able to point to the activity driver, the variable cost, and the fixed-cost burden before approving a price, a hire, or a new commitment.
Pricing
For the law firm, start with contribution margin per billable hour. If an hour brings in revenue but requires contract support, research assistance, or another direct delivery cost, the full revenue amount isn't available to cover rent and core payroll. The firm's minimum price should cover the variable cost of delivering the hour and leave enough contribution margin to support fixed costs and profit.
For the dental practice, use the same logic per visit. A price that looks acceptable against the total monthly P&L may be weak after supplies and lab fees. A price change makes sense when the existing contribution margin doesn't cover the fixed-cost load at a realistic schedule.
Hiring
A roofer should hire a technician only when the added contribution margin from expected extra jobs covers the technician's full incremental cost. The formula is:
Extra jobs required = Added payroll and related cost ÷ Contribution margin per additional job
Do not count hoped-for sales as capacity. Count jobs the current pipeline and available demand can support. If the new person lets the company complete more profitable work, the hire may pass the test. If the person only spreads the same work across more payroll, the numbers say wait.
Cash
A contribution margin forecast helps an owner see how much cash each sale contributes toward fixed obligations during a slow quarter. Keep fixed commitments visible, map expected activity by month, and test what happens if volume falls while rent, insurance, core payroll, and debt payments remain.
A cash reserve should be based on the business's own fixed-cost exposure and seasonal risk, not a universal rule copied from another company. Trades businesses may need more protection when work is weather-sensitive. A professional services firm may need less equipment cash but more payroll flexibility.
Owners should also time price changes before the period when customers are busiest, so the new rate reaches quotes and renewals before capacity tightens. A receipt process such as receipt capture for sole traders can help keep small purchases attached to the right cost category, which makes the forecast less dependent on memory.
Decision rule: Raise prices when contribution margin is too thin, hire when added contribution margin covers the added role, and protect cash when fixed commitments remain high while activity is uncertain.
Mistakes That Quietly Break Every Cost Forecast
A cost forecast can look polished and still be wrong. The errors usually come from treating a useful shortcut as a permanent truth.
Treating the relevant range as optional
A fixed cost may stay flat until the business needs a second shift, another vehicle, a larger facility, or outsourced overflow. At that point, the cost steps up.
Diagnostic: Look for costs that jumped after capacity became tight.
Fix: Create a new cost band for the higher activity level instead of extending the old line forever.
Averaging through seasonality
A slow winter month and a busy summer month may have different staffing, material, and utilization patterns. A single average can flatten a real operating cycle.
Diagnostic: Plot every month and look for clusters or outliers.
Fix: Forecast by season or job type when the scatter plot shows distinct patterns.
Calling lease costs permanently fixed
Rent may be fixed during the current lease, but a renewal can reset the amount. A new location can also create a step increase.
Diagnostic: Read the lease calendar beside the forecast.
Fix: Add known renewal dates and new-location scenarios to the model.
Calling software fully variable
A software plan may charge by seat but also include an annual minimum or a base platform fee.
Diagnostic: Compare the invoice structure with actual user and usage changes.
Fix: Split the cost into its base and usage components.
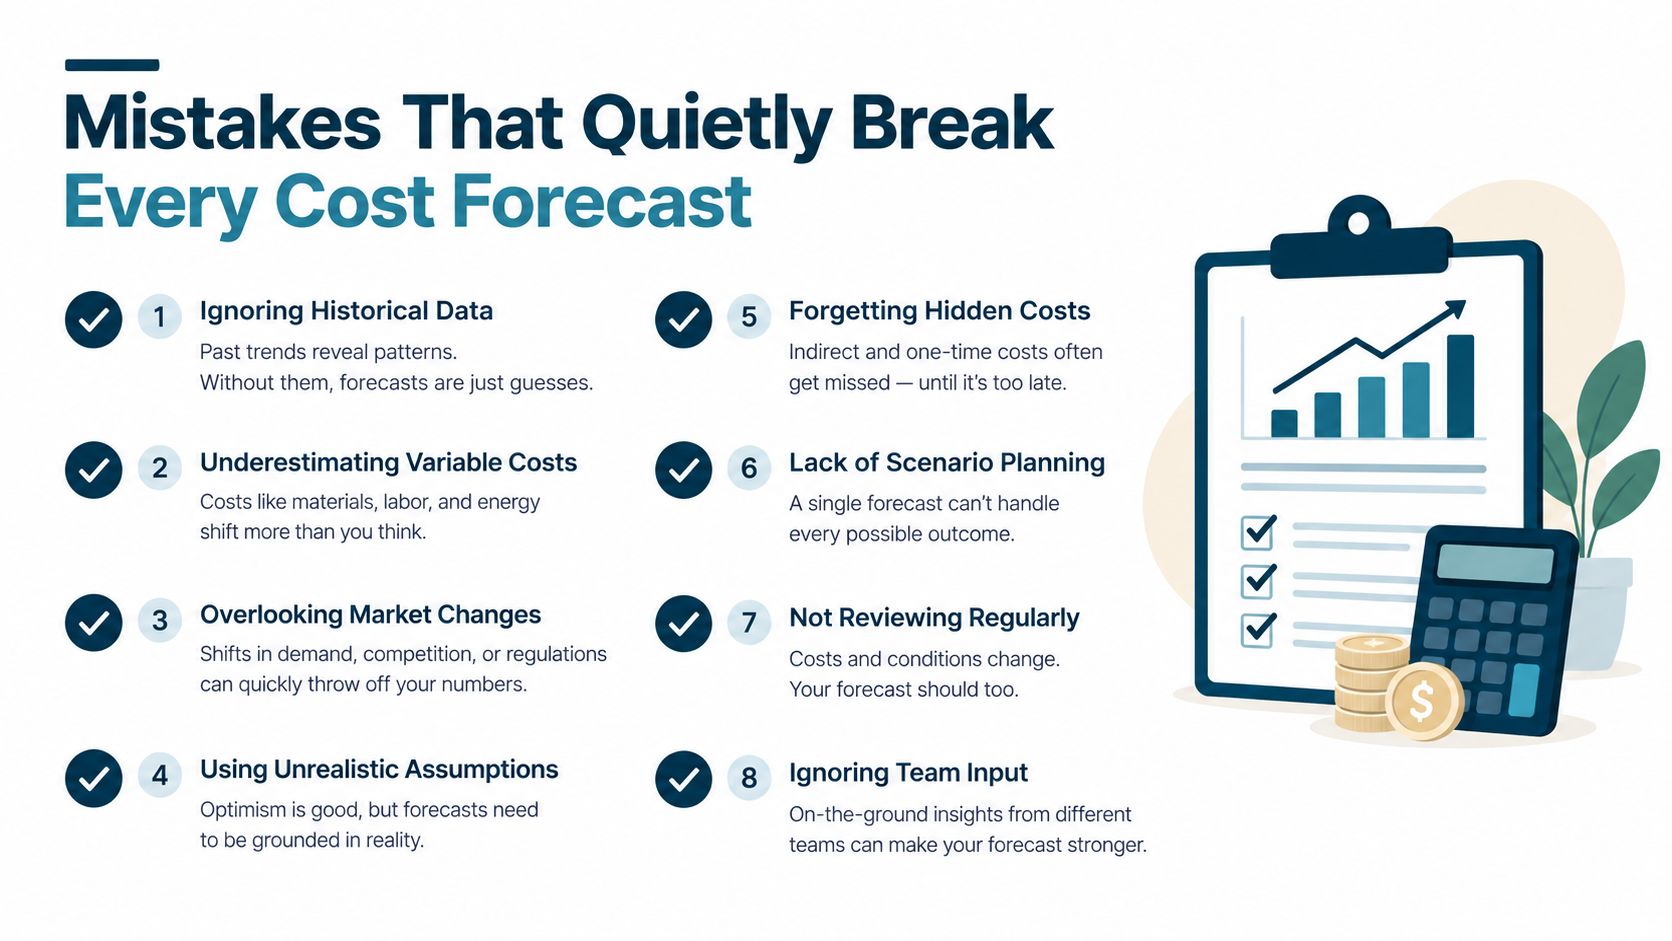
One more mistake deserves attention: using only one activity driver. A clinic may need visits, procedure mix, and lab work. A contractor may need jobs, square footage, materials, and subcontractor hours. If several drivers move the expense, one blended rate can mislead the owner.
Your Monthly Cost Behavior Report and When to Get Outside Help
Build the report in Google Sheets with five core lines. Keep the layout simple enough to refresh without turning it into a second job.
- Revenue: Total sales for the month.
- Variable costs: Costs that move with the selected activity.
- Contribution margin: Revenue left after variable costs.
- Fixed costs: Costs that remain within the current relevant range.
- Net: Contribution margin less fixed costs.
Use these formulas:
Variable cost rate = Variable costs ÷ Revenue
Contribution margin ratio = 1 minus variable cost rate
Break-even revenue = Fixed costs ÷ Contribution margin ratio
| Line Item | This Month | Trailing 12-Mo Avg | Variance % | Action Trigger |
|---|---|---|---|---|
| Revenue | Enter actual | Calculate average | Compare actual with average | Investigate a meaningful volume change |
| Variable costs | Enter actual | Calculate average | Compare rate, not only dollars | Review pricing or delivery cost |
| Contribution margin | Revenue less variable costs | Calculate average | Compare margin ratio | Test service or job profitability |
| Fixed costs | Enter actual | Calculate average | Compare recurring commitments | Check new hires, leases, and renewals |
| Net | Contribution margin less fixed costs | Calculate average | Compare operating result | Decide whether to adjust spending or pricing |
Set aside a short monthly review. Refresh the scatter plot, compare the current month with the trailing twelve-month average, and revisit the regression model each quarter when the data supports it. If revenue swings sharply, the business adds a location or service line, or the owner spends too much time wrestling with the books, outside help is sensible.
A fractional CFO can turn the report into pricing, hiring, and cash decisions. An industry-experienced bookkeeper can improve coding, reconciliations, and monthly reporting. A cost accountant can build a more detailed model for jobs, departments, or multiple drivers.
MyOfficeOps helps small and midsize businesses organize bookkeeping, financial reporting, forecasting, and CFO-level analysis around decisions like pricing, hiring, cash flow, and profitability. Visit MyOfficeOps to turn your monthly cost behavior report into a working management tool.