
You finish a strong sales month, open the business bank account, and wonder where the money went. Revenue is climbing, the team is busy, and customers keep coming in, yet the balance still feels tight. Taxes, slow-paying clients, and seasonality may explain part of the pressure, but they don't show which products, customers, or jobs are creating profit.
That's the question behind what is profitability analysis. It's the process of breaking down return on equity and profit performance into the business activities that create or erode value, instead of treating bottom-line profit as one mysterious score. The analysis helps you see the difference between being busy and being profitable.
The Moment Every Growing Business Eventually Hits
A small agency owner finishes a strong month with a packed calendar and a revenue report that beats the previous one. The bank account should look healthier. Instead, there is only enough cash for payroll, vendors, and the next batch of bills.
Seasonality may explain part of the squeeze. So may slow-paying clients, tax payments, software renewals, or a supplier invoice arriving at an awkward time. Those events matter, but they do not answer the business question: which work produces cash and profit, and which work consumes both?

Revenue can hide a weak result
More sales can leave a business with less profit. Discounts reduce the price collected. Payment fees, freight, commissions, delivery time, rework, and customer support may rise with every order. Rent, salaries, software, and administration then reduce what remains.
Profitability analysis examines those layers instead of stopping at revenue. A 2026 industry dataset covering 5,994 U.S. firms reported an average gross margin of 37.76% and an average net margin of 9.74% (Columbia Business School lecture note). The gap illustrates why a healthy sales line can end in a much smaller final profit.
Practical rule: A busy month measures how much work passed through the business. Profitability analysis tests whether that work earned its place on the calendar.
The useful questions become more specific: Which service covers its direct costs? Which customer needs too much rework? Which job looks attractive before shared overhead is assigned, then weakens afterward? Answering them requires clear margin measures, sensible business segments, and a cost-allocation method that is useful without pretending to be perfectly precise. The results can shape pricing, hiring, service-line choices, and cash decisions.
Breaking Down the Four Margins Most Owners Confuse
A bakery can sell a popular custom cake and still discover that the order contributed less than expected. The reason becomes clearer when you follow the revenue through four margin checkpoints. Each measure removes another category of cost, so the final result does not get mistaken for the starting sale price.
Suppose a neighborhood bakery sells a custom cake for $1,000 and spends $600 on flour, sugar, and other direct ingredients. Its gross profit margin is 40%, calculated as revenue minus direct costs, divided by revenue, as shown in this explanation of the gross profit margin formula and bakery example. You can also review the gross profit margin guide for the calculation.
Start with the direct economics
Gross margin asks whether the price covers the direct cost of making the cake. Include direct labor with ingredients when your accounting setup can support it. Gross margin highlights pricing and production problems, but it does not include delivery or the cost of keeping the bakery open.
Contribution margin removes variable costs that rise with each sale, such as packaging, delivery, card fees, sales commissions, and usage-based delivery expenses. What remains helps pay fixed overhead and operating income. For comparisons across products, customers, or channels, this measure is often especially useful because it shows what each sale contributes after volume-related costs.
Operating margin subtracts operating costs, including rent, regular payroll, and administrative salaries, from operating profit. It shows whether the core operation works after paying to run the business, before financing and tax effects.
Net margin is the final layer. It equals net income divided by net sales after operating costs, interest, taxes, and other expenses. If revenue is $200,000 and net income is $20,000, the net profit margin is 10%, following this net profit margin definition and formula.
| Margin | What It Subtracts | What It Reveals |
|---|---|---|
| Gross margin | Direct production or delivery costs | Basic pricing and production economics |
| Contribution margin | Variable costs tied to each sale | What each product, customer, or channel contributes toward fixed costs |
| Operating margin | Operating expenses | Strength of the core business model |
| Net margin | All remaining costs, including interest and taxes | What the owner ultimately keeps from sales |
Use the margins together rather than treating one as the final score. A cake may have a strong gross margin but a weak contribution margin if delivery takes too long. A bakery may have sound contribution economics yet a thin net margin because rent, payroll, or debt costs are too heavy. The earlier firm dataset reported separate gross and net averages, not one universal “healthy” margin, reinforcing the need for business and industry context.
Cutting the Business Into Products, Customers, Jobs, and Channels
An overall profit number is a map of the whole town. It doesn't tell you which streets are thriving and which ones need repairs. Profitability analysis becomes useful when you cut the business into smaller views.
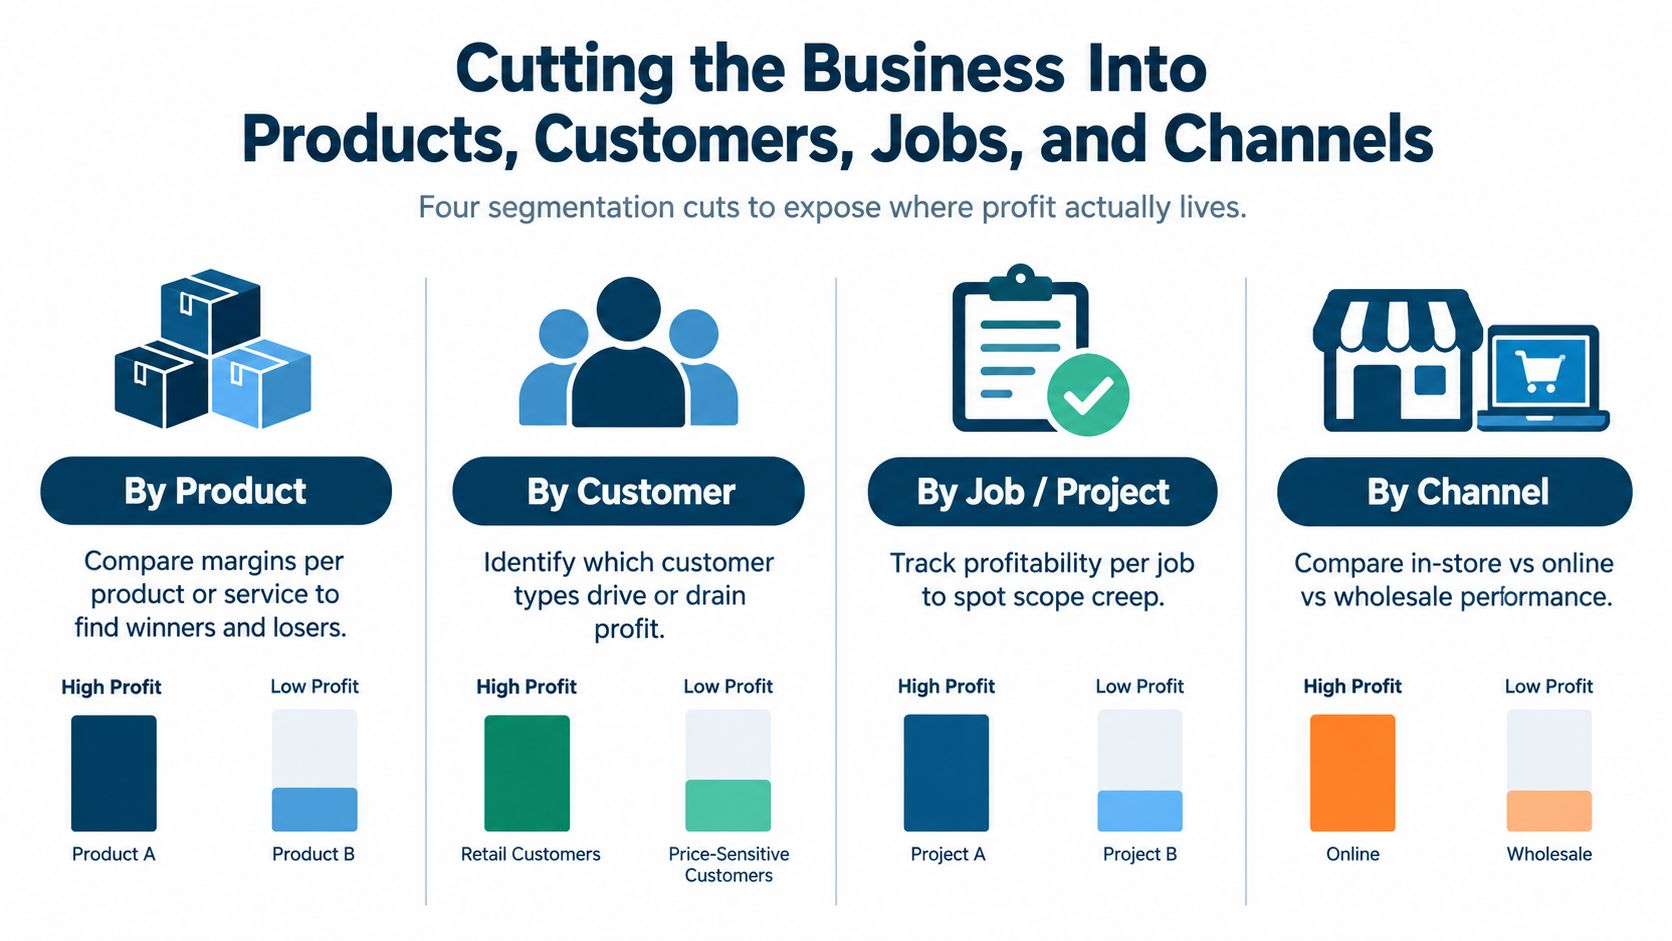
Four useful lenses
By product or service. A contractor might compare kitchen renovations, bathroom repairs, and maintenance calls. The comparison can reveal that one service sells often but requires heavy supervision, while another has fewer sales and cleaner delivery. You'll need revenue, direct costs, labor time, and a reasonable share of overhead.
By customer. Two customers can pay similar invoices while creating very different workloads. One sends complete information and pays promptly. Another needs repeated calls, custom reporting, urgent changes, and extra meetings. Customer-level analysis requires time records, support activity, discounts, payment costs, and direct service expenses.
By job or project. A design firm, construction company, or IT consultant should track the economics of each job. The useful question isn't just whether the invoice was collected. It's whether the project paid for the hours, materials, subcontractors, travel, revisions, and management attention it consumed. A practical introduction to tracking those costs is this guide to what job costing means for small businesses.
By channel. A subscription shop may sell through its website, a physical store, wholesale partners, and referrals. Each channel carries different fees, fulfillment work, discounts, and acquisition costs. Channel analysis can show that online orders look attractive until shipping and returns are included, while wholesale volume may require a price structure that protects contribution dollars.
The right cut depends on how work enters and moves through your business. A law firm may start with client and matter profitability. A restaurant may start with menu items and delivery channels. A trades business may need job profitability first, because scope changes and unbilled rework can erase a project's apparent return.
Keep the views connected. A low-margin customer may be profitable through one channel but costly through another. A service can look healthy overall while one type of job absorbs the owner's time.
A Step-by-Step Process Small Business Owners Can Actually Follow
You don't need a large finance department to begin. You do need clean categories, consistent logic, and the discipline to use the same method each time.
Build the analysis in five moves
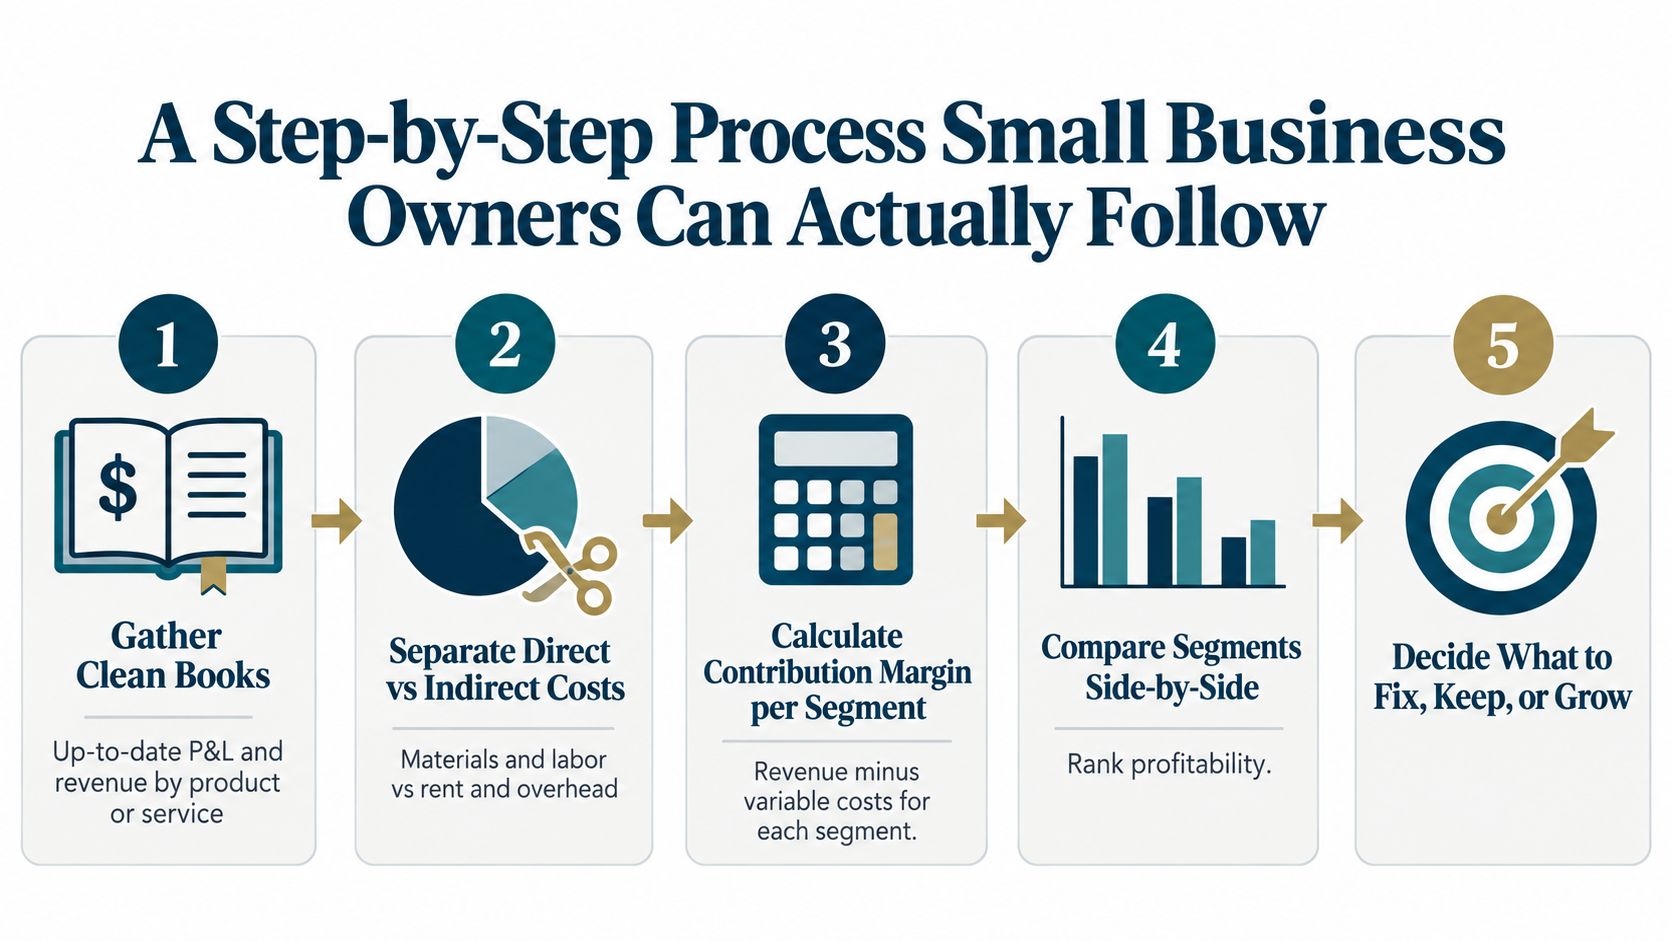
Gather clean books. Start with an up-to-date profit and loss statement, revenue by product or service, and a complete expense list. Check that the period, accounting method, and categories match.
Separate direct and indirect costs. Materials, subcontractor fees, delivery charges, and sales commissions often move with sales. Rent, salaried payroll, software, and general administration usually support the business more broadly.
Choose an allocation method. Assign costs directly when you can. For shared overhead, document a defensible basis, such as labor hours, transactions, occupied space, or management time. Activity-based costing assigns resource costs to activities and then assigns activity costs to products, customers, or jobs through cost drivers. Time-driven versions use estimates of the minutes required for each transaction type, which can be helpful in service and B2B operations (activity-based costing explanation).
Calculate contribution margin. Run the calculation at the level that matches the decision, such as product, customer, job, channel, or a combination of product and channel.
Rank by margin dollars. A high percentage on a tiny revenue line may matter less than a lower percentage on a large line. Ranking by margin dollars helps you find the leaks with the biggest economic effect.
Where spreadsheets start to wobble
Spreadsheets are useful for a first pass, but shared-cost allocation becomes fragile when expenses sit across many products, jobs, or channels. A 2025 Deloitte and IMA survey found spreadsheets were the most common performance modeling tool at 30%, while AI analytics stood at 3% (Fathom's discussion of profitability analysis and the survey). Those figures don't prove that every spreadsheet is bad. They do show why many businesses lack reliable driver-based allocation and scenario analysis.
Use a short weekly review to keep the model alive. Spend 15 minutes checking new work, discounts, delivery costs, unusual support demands, and changes in job scope. If you also want to know the sales level where profit becomes possible, use the break-even approach of fixed costs divided by contribution margin per unit or contribution margin ratio (break-even analysis calculation).
Two Mini Stories That Show How the Same Revenue Can Hide Very Different Realities
Consider a four-person creative agency billing $1.4 million a year. The owners felt broke despite the impressive revenue. A profitability review traced project manager hours and found that one legacy client consumed 30% of project manager time while paying below-market rates. Three newer retainers were producing enough contribution to subsidize the old account.
The fix wasn't automatically “sell more.” The owners had to decide whether to raise the legacy client's price, reduce the service scope, or end the relationship. Revenue had created the illusion of strength, while customer-level activity had exposed the drain.
A solo contractor faced the opposite-looking problem. Revenue reached a record $380,000 year, and the owner felt proud of the result. After allocating materials, truck wear, travel, and unbilled rework to each job, the contractor saw that some projects earned less than minimum wage for the owner's actual time.
The two businesses had different leaks. The agency needed customer and labor-time visibility. The contractor needed job costing and a fuller overhead allocation. Both needed to stop treating invoiced revenue as proof that the work was paying off.
| Metric | Creative Agency | Solo Contractor |
|---|---|---|
| Revenue story | $1.4 million billed in the year | $380,000 revenue in the year |
| Hidden cost | Legacy client consumed 30% of project manager hours | Materials, truck wear, travel, and unbilled rework |
| Allocation lens | Customer and staff time | Job and overhead costing |
| Decision pressure | Reprice, narrow, or end the account | Reprice jobs and control rework |
These examples also show why cost allocation isn't a minor accounting detail. It determines whether the business sees the cost of serving a customer or completing a job. Once that view is clear, the next decisions become much less personal and much more specific.
Turning the Numbers Into Pricing, Hiring, and Cash-Flow Decisions
Profitability analysis earns its keep when it changes a decision. A report that sits in a folder won't improve pricing, staffing, or cash.
Use contribution dollars to choose the move
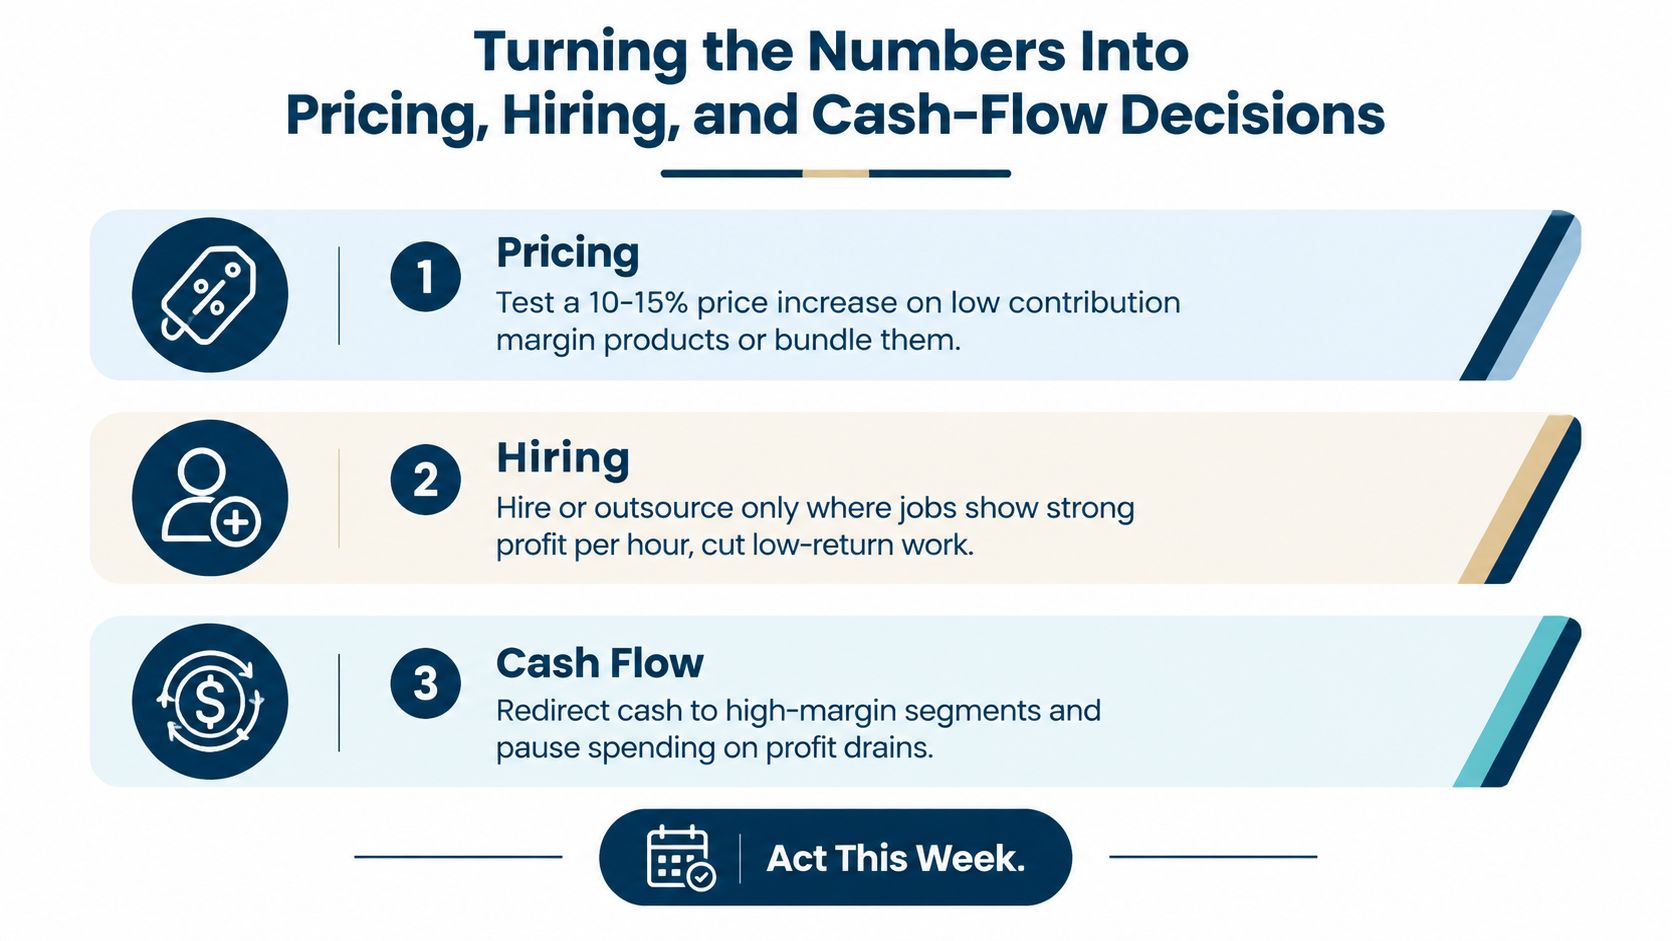
If a product or service ranks low on contribution margin, don't assume more marketing will solve it. Test a 10% to 15% price increase or reduce the scope, delivery burden, packaging, or support included with the sale. The exact test should be discussed with your bookkeeper or CFO advisor, because customer sensitivity and contract terms matter.
For hiring, compare the expected contribution margin with the fully loaded cost of the role. A conservative planning rule is to wait until contribution margin covers at least 1.5 times that cost, then test the assumption against realistic demand and capacity. A thin-margin business can make a good hire feel bad if the role adds fixed costs before profitable work is ready.
Ask your adviser: “Which service produces the most margin dollars per hour of owner and employee time?”
Let the analysis guide the portfolio
Consider retiring an offering that sits in the bottom quartile by margin dollars and consumes a disproportionate amount of support time. Before cutting it, check whether the offer brings in profitable follow-on work or serves a strategic customer group. The point isn't to remove anything that looks inconvenient. It's to stop protecting work that repeatedly consumes more economic value than it creates.
Cash planning needs the same honesty. Net margin, payment timing, and seasonality should inform a reserve target of one to three months of operating expenses. Restaurant owners may also benefit from a practical resource on how to forecast labor costs for restaurants because staffing decisions can affect both service capacity and contribution.
Use these as discussion prompts, not automatic rules. Bring the segment ranking, the cost assumptions, and the proposed action to your bookkeeper or CFO advisor. Ask which assumption is weakest before you commit cash.
The Five Profitability Mistakes That Quietly Drain Growing Businesses
Growing owners rarely make these mistakes because they don't understand business. They make them because the monthly routine rewards speed, sales, and visible activity while hiding the cost of complexity.
Five habits to replace
Stopping at gross margin. The reflex is to celebrate strong product economics and ignore rent, software, owner pay, and administration. The warning sign is a healthy gross margin paired with a weak net result. Ask, “How much shared overhead does this product, customer, or job consume?”
Chasing margin percentage. A tiny premium service can show a better percentage than a high-volume line while producing fewer margin dollars. The warning sign is a proposal to drop a busy offer because its percentage looks ordinary. Ask, “Which option creates more total contribution?”
Mixing personal and business expenses. Personal spending inside the business makes operating costs harder to read and can distort product or job profitability. The warning sign is a bookkeeper who must guess whether a transaction belongs in the business. Ask, “Can we separate every recurring personal item before reviewing margins?”
Skipping contribution margin. Owners sometimes cut prices to win volume without checking whether the sale still covers variable costs. The warning sign is more orders with no improvement in cash or operating profit. Ask, “After delivery, commissions, materials, fees, and rework, what does this sale contribute?”
Trusting revenue growth. Sales can rise while fixed costs, support demands, and administrative work expand underneath. The warning sign is a larger team and fuller calendar with no matching improvement in cash. Ask, “What changed in margin dollars after the growth arrived?”
A monthly profitability habit closes these gaps. Review the same segments, use the same allocation logic, and record the decision that follows. Consistency matters more than building a perfect model once and abandoning it.
How MyOfficeOps Helps You Move From Numbers to Better Decisions
Profitability analysis works best as a routine, not a yearly investigation. The foundation is clean, categorized bookkeeping, because every margin calculation depends on whether revenue and expenses are recorded in the right place and period.
MyOfficeOps combines a monthly bookkeeping service with a Profit Optimization service. The bookkeeping work supports reliable financial statements. The optimization work can map revenue and costs by product, customer, job, or channel, then turn the findings into practical decisions about pricing, service lines, hiring, and cash reserves.
From reports to an operating rhythm
A fractional controller can help you answer questions that a standard income statement can't answer on its own:
- Which customers consume too much support time?
- Which jobs lose money after rework and travel?
- Which channel produces the strongest contribution dollars?
- Which price or scope change deserves a test?
- How much cash should remain available before adding fixed costs?
The engagement begins with a discovery call to review the current P&L and identify the single most important question. That creates a clearer starting point than ordering a large report before anyone knows what decision the business needs to make.
The goal is clarity plus cadence. Each month, the owner should know which dollars are working hardest, which work needs a new price or tighter scope, and where the bank balance is being consumed. The numbers won't make every decision comfortable, but they can make the trade-offs visible.
MyOfficeOps provides bookkeeping, financial analytics, and Profit Optimization support for small and midsize businesses that want clearer answers about margins, job costs, and cash flow. Visit MyOfficeOps to schedule a discovery call and identify the profitability question your business should answer first.