Financial reporting sounds complicated, but you already get the basic idea. If you’ve ever had a lemonade stand, you know you had to track what you spent on sugar and lemons (your costs) against the money you made from selling drinks (your revenue). The cash left in your jar at the end of the day was your profit. That’s really all financial reporting is.
For a small business, it’s the same idea, just with a few more things to track. It isn't about fighting with confusing spreadsheets. It’s about telling your business’s story with numbers.
These stories answer the questions that probably keep you up at night:
- Are we actually making money?
- Can we afford to hire that new person we really need?
- Do we have enough cash to get through a slow month?
- Is now a good time to buy that new piece of equipment?
Without these reports, you’re flying blind. You might feel like business is good, but you won't know for sure until you look at the numbers. Gut feelings are great, but they don't pay the bills.
The Scoreboard, The Roster, and The Fuel Gauge
To get the full story of your business, you need three main reports. I call them the "Big Three" because each one gives you a different, but equally important, piece of the puzzle. You can think of them as your business's scoreboard, team roster, and fuel gauge.
This is how they all fit together:
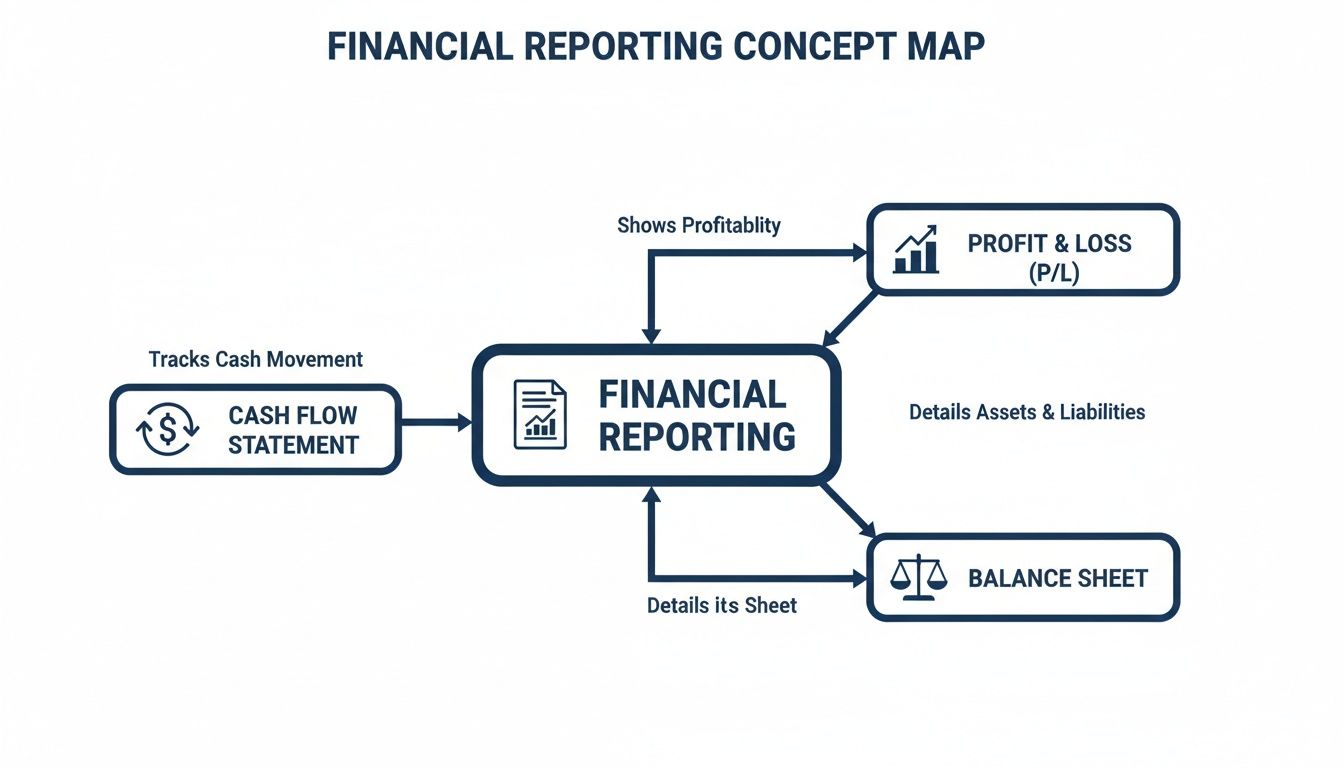
The Profit & Loss, Balance Sheet, and Cash Flow Statement each give you a unique look into how your company is doing.
Financial reports are your guide for making better business decisions. They replace guesswork with facts, giving you the confidence to lead your company toward growth and stay out of trouble.
Let's put this into perspective. One study found that 34% of small business owners check their financial statements weekly, and another 21% look at them every single day. There's a reason for this. It helps them make smart, quick decisions that helped them earn a combined $1.2 trillion in profits in just one quarter.
To help you get started, we've broken down these three core reports into a simple table.
The Three Core Financial Reports at a Glance
| Report Name | What It Answers | Simple Analogy |
|---|---|---|
| Profit & Loss (P&L) | "Are we winning the game?" | The Scoreboard. It shows your income (points for) versus your costs (points against) over a set time, like a quarter or a year, to tell you if you made a profit or a loss. |
| Balance Sheet | "Who is on our team?" | The Team Roster. It lists everything you own (assets), everything you owe (liabilities), and your company's net worth (equity) on a single day. |
| Cash Flow Statement | "Do we have enough energy to finish the game?" | The Fuel Gauge. It tracks the actual cash moving in and out of your bank account, showing if you have enough fuel to keep things running. |
Understanding the difference between the Balance Sheet vs Income Statement is the first step to really knowing your numbers. These two reports, plus the cash flow statement, are the foundation of your financial story.
In the next sections, we’ll break down each of the "Big Three" in simple terms so you can stop guessing and start using them to your advantage.
Your Financial Scoreboard: The Profit and Loss Statement
Let's start with the report every business owner knows: the Profit and Loss statement, or P&L. Think of it as your business’s scoreboard. At the end of a game, you look at the score to see who won. The P&L tells you if your business “won” (made a profit) or “lost” over a certain time—like a month, a quarter, or a year.
It tells a simple story. It starts with all the money your business earned, then subtracts all the money you spent to earn it. What’s left over is what you actually get to keep.

Breaking Down Your P&L Step by Step
A P&L always follows the same logical order, like a short story with a clear beginning, middle, and end.
Revenue (The Top Line): This is the very first number at the top. It’s every dollar you brought in from sales before any costs are taken out. If you sold 100 toys at $10 each, your revenue is $1,000. Easy.
Cost of Goods Sold (COGS): This is what it cost you to make the products you sold. For a baker, this would be the flour and sugar, not the oven. For that $1,000 in toy sales, your COGS would be the plastic and paint used to make those specific toys.
Gross Profit: This is your first big checkpoint. You get it by subtracting COGS from your Revenue. This number tells you how much money you made just from selling your product, before we look at the other costs of running the business.
After you know your gross profit, we look at the costs of just keeping the doors open.
The Cost of Doing Business
This is where your Operating Expenses (often called OpEx) come in. These are the costs you need to pay to keep the lights on, but they aren’t directly tied to making the specific thing you sold.
Let’s say you run a small local bakery. Here's how it breaks down:
- COGS would be: The flour, sugar, eggs, and chocolate chips you used for the cookies you sold this week.
- Operating Expenses would be: The rent for your shop, the electricity bill, your cashier's salary, and what you spent on that Facebook ad you ran.
You have to pay for these things whether you sell one cookie or one thousand. When you subtract all these operating expenses from your gross profit, you get your Operating Income. This shows the profit from your main business activities.
The P&L isn’t just for seeing if you’re profitable today. It’s a tool for spotting trends. If your marketing costs are climbing way faster than your sales, it’s a clear signal to rethink your strategy.
The Bottom Line: Net Profit
Finally, after all income and all costs are counted, you get to the most famous number on your P&L: Net Profit. This is the "bottom line." It’s the actual cash you’ve earned that you can decide what to do with—reinvest in the business, save for a rainy day, or finally pay yourself.
Let's use a freelance graphic designer as another example. Say she made $10,000 in revenue last quarter from client projects.
- Her COGS might be the cost of stock photos and special fonts she bought for those projects, totaling $500. Her Gross Profit is $9,500.
- Her Operating Expenses include her design software subscription ($300), home office internet ($240), and marketing costs ($500). Her total OpEx is $1,040.
- Her Net Profit for the quarter would be $9,500 – $1,040 = $8,460.
Seeing this number helps her know if her pricing is right. If that $8,460 feels too low for three months of hard work, she has a real reason to raise her rates. For a more detailed walkthrough, you can explore our Profit and Loss Statement example to see how these numbers fit together. This is the kind of financial reporting for small business owners that turns good ideas into lasting companies.
Your Financial Snapshot: The Balance Sheet
If your Profit & Loss statement is the highlight reel of your business over a month or quarter, the Balance Sheet is a single picture. It doesn't show you the action over time; it freezes a moment to show your business’s exact financial position on one specific day.
It’s the report that answers the big question every owner has: "What is my business really worth, right now?" It gives you a clear picture of what you have, what you owe, and what’s actually yours.

The Three Parts of the Puzzle
Every balance sheet is built from three main pieces. Once you see how these parts fit together, the whole report makes sense.
Assets: This is all the valuable stuff your business owns. Think of it as everything from cash in the bank and your equipment to the money customers still owe you (accounts receivable).
Liabilities: This is simply what your business owes to others. It’s your list of debts, including bank loans, credit card balances, and the money you owe suppliers (accounts payable).
Equity: After you subtract what you owe (Liabilities) from what you own (Assets), what’s left is your Equity. This is the true value of your ownership in the business.
These three parts are connected by one simple rule that never breaks. It’s the foundation of all accounting.
Assets = Liabilities + Equity
There’s a reason it’s called a “balance” sheet—this formula must always be true. The value of everything you own has to be balanced by what you owe to others and what you own yourself. If it doesn't balance, it's a big sign that something is wrong in your books.
A Real-World Example: A Landscaping Company
Let’s make this real. Imagine you own a small landscaping business. Your balance sheet will give you a perfect financial picture on, say, the last day of the year.
Here’s what that picture might look like:
Assets: You have $10,000 in your business bank account. You own a truck and mowers worth $25,000. Plus, you have $5,000 in invoices for jobs you just finished (your accounts receivable). Your total assets are $40,000.
Liabilities: You still have a $15,000 loan on that truck. You also owe your mulch supplier $2,000 for a recent delivery. Your total liabilities are $17,000.
Now, let's use our formula.
Assets ($40,000) = Liabilities ($17,000) + Equity (?)
To make it balance, your Equity must be $23,000. That $23,000 is your personal stake in the company. It’s the value you'd have left if you sold all your assets and paid all your debts today.
The balance sheet is a key part of financial reporting for small businesses because it tells you about your company’s stability. While a P&L shows if you're making a profit, the balance sheet shows if you have a strong enough foundation to keep that profit and grow. To go deeper, you can check out our guide on how to read a balance sheet for more tips.
Your Business Fuel Gauge: The Cash Flow Statement
If your Profit & Loss statement is the scoreboard, the Cash Flow Statement is your car’s fuel gauge. And I can tell you, it's the one report that will keep your business from breaking down. You can be profitable on paper but still run out of actual money to pay your bills.
This is a dangerous trap for a growing business. The P&L might show a big profit, but if your clients haven't paid their bills yet, that profit isn’t in your bank account. The cash flow statement is the only report that tracks real money moving in and out of your business. It makes sure you never run on empty.
The Three Buckets of Cash
Your cash flow statement sorts every dollar into three simple groups. Think of them as different faucets controlling the money flowing into and out of your business’s tank.
Cash from Operations: This is the lifeblood of your business—the money that comes from your main activities. It’s the cash you get from customers, minus what you spend on inventory, payroll, and rent. A healthy business always has more cash coming in from operations than going out.
Cash from Investing: This group tracks cash used to buy or sell long-term things like equipment. For a pizza shop, this would be the cash spent on a bigger oven. If they sold an old delivery car, the cash from that sale would go here.
Cash from Financing: This is all about cash from owners and lenders. When you take out a business loan, that money shows up here. The same goes for any money you personally put into the business or, on the other hand, any loan payments you make.
Understanding these three buckets is important. They show you exactly how your business is being funded—is it running on customer sales, taking on debt, or are you propping it up with your own money?
The Classic Trap: Profit vs. Cash
Let me tell you about a small retail client I once had. On paper, they were doing great. Sales grew every month, and their P&L looked fantastic. But behind the scenes, the owner was always panicking.
Why? Most of their sales were on credit cards, and it took days for that money to actually land in their bank account. Meanwhile, rent was due, employees needed to be paid, and suppliers wanted their money now. The business was profitable but cash-poor, and it nearly failed just waiting for money to arrive.
This is the huge difference between profit and cash flow.
A Cash Flow Statement would have shown them this problem weeks in advance. It shows the gap between when you earn money and when you actually get it, giving you time to prepare.
For many owners, this is a big headache. A recent report on small business trends showed that cash flow is still a major problem, with 29% of owners saying it's a big issue. This is right alongside inflation, which 31% pointed to as a top concern. Good reporting helps business owners face these challenges, which is vital since 74% expect their sales to increase. You can explore more insights from the OnDeck/Ocrolus Small Business Cash Flow Trend Report to see how others are handling it.
The cash flow statement is your early warning system. It helps you see cash shortages coming so you can get a line of credit, delay a big purchase, or chase down unpaid invoices before it becomes a real emergency. It turns you from an owner putting out fires to one building a business that lasts.
Using Your Reports to Make Smart Decisions
Alright, you've got your financial reports. Now what? For a lot of business owners, this is where the process stops. The reports get filed away, and it’s back to running the business on a gut feeling. But that's like a pilot ignoring their dashboard and just hoping they’re flying in the right direction.
Having the P&L, Balance Sheet, and Cash Flow Statement is one thing. Actually using them to make smarter business moves is where the real magic happens. These documents are full of clues about your business's health, its strengths, and its hidden problems. The trick is knowing what to look for and what questions to ask.

Turning Numbers Into Actionable Clues
Let's connect what the reports say to the real-world decisions you have to make. Your financials are always sending you signals—your job is to learn how to listen and act on them.
For example, you might see on your Profit & Loss statement that your supply costs are slowly going up each month. That’s not just a number; it’s a signal. It’s telling you it’s time to look for new suppliers, try to get a better deal with your current ones, or see if a small price increase is needed to protect your profit.
Or maybe you see on your Balance Sheet that Accounts Receivable—the money your customers owe you—is growing way faster than your sales. This is a huge red flag. It means clients are taking longer to pay you, which puts a big strain on your cash. The right move? Change your payment terms, start sending reminders sooner, or even offer a small discount for early payments.
A Metric Every Service Business Should Live By
Beyond just looking at the big numbers, you can calculate simple percentages to get deeper insights. One of the most powerful is your Gross Profit Margin.
Don't let the name scare you. It just tells you what percentage of your revenue is left after covering the direct costs of providing your service or making your product.
Let's say you're a contractor who just finished a kitchen remodel for $25,000 in revenue. The materials and your subcontractors' labor—your Cost of Goods Sold (COGS)—added up to $15,000.
- Your Gross Profit is $25,000 – $15,000 = $10,000.
- Your Gross Profit Margin is ($10,000 / $25,000) = 40%.
Knowing that 40% is incredibly useful. If you do another job that only has a 25% margin, you can immediately ask why. Were your material costs too high? Did you underbid the project? This one number helps you price future jobs to make sure you're actually making money. For a deeper dive into these kinds of numbers, our guide on what is financial statement analysis can show you how to connect all the dots.
Making a profit is a major challenge. Recent surveys show that while 65% of small business owners feel their business is 'good' or 'very good,' only 46% were actually profitable. The good news is that 71% saw their finances improve from one year to the next, often because they started checking their numbers more often—some weekly or even daily. You can see more small business statistics that highlight this trend.
Your Monthly Financial Check-in Questions
The key to making data-driven decisions is building the habit of reviewing your reports. You need to set aside time each month to sit down with your "Big Three" reports and ask yourself some simple questions.
Here’s a checklist to get you started:
- Looking at the P&L: Where did we spend more than we planned? Are any of our costs growing faster than our sales?
- Looking at the Cash Flow Statement: Did our cash balance go up or down, and why? Do we have enough cash for big bills coming up, like taxes or payroll?
- Looking at the Balance Sheet: Are our clients paying us on time? Are our debts growing faster than our assets?
- Looking at All Three: What was the biggest surprise this month? What is one thing we can change next month to improve these numbers?
Answering these questions regularly is what turns financial reporting from a chore into your best tool for success.
Knowing When to Ask for Help with Your Finances
Every business owner is used to wearing many hats—you're the CEO, the main salesperson, and the chief problem-solver. But when you start adding “late-night bookkeeper” to that list, you’re not just wearing another hat; you’re setting yourself up for burnout and big mistakes.
Eventually, you have to bring in an expert so you can focus on what you do best: running the business and helping it grow.
The big question is, when is it time to get help? The signs are usually right in front of you. You might be spending your weekends buried in paperwork instead of relaxing. Or maybe you're staring at your financial reports, not sure if the numbers are even right, which makes every big decision feel like a gamble.
If you feel a knot in your stomach when you think about hiring someone or buying new equipment, that’s a big red flag. It means you don't have the financial clarity you need to move forward. Getting help isn’t giving up; it’s one of the smartest moves you can make for your business.
Who to Call for Financial Help
Deciding you need help is the first step. The next is figuring out who to call. Not all financial pros do the same job. Think of it like building a house: you need different experts for different tasks.
Here’s a simple breakdown of the three key players:
Bookkeeper: This is your foundation builder. A bookkeeper’s job is to record every single transaction your business makes—every sale, every purchase, every bill paid. They keep your financial data clean and organized.
Accountant: This is your home inspector. An accountant takes the organized data and turns it into official reports like the P&L and Balance Sheet. They check these reports, make sure everything is accurate, and often handle your taxes.
Fractional CFO: This is your architect. A fractional Chief Financial Officer doesn't just look at what already happened; they help you plan what happens next. They use your financial reports to give you high-level advice, helping you plan for the future, make big decisions, and map out a clear path to your goals without the cost of a full-time executive.
Bringing in an expert isn’t about losing control of your finances. It’s about gaining it. An outside partner gives you back your time and provides the trustworthy numbers you need to lead your business with confidence.
Handing off your financial reporting for small business to a professional frees you up. Instead of fighting with spreadsheets late at night, you can get back to serving your customers and growing your company. You get clean, reliable reports and an expert who can help you understand what the numbers are telling you. This clarity lets you stop guessing and start making smart decisions that build a stronger, more profitable business.
Your Financial Reporting Questions, Answered
When business owners first start looking at their financials, the same questions always come up. Let's clear them up so you can move forward.
How Often Should I Review My Financial Reports?
My go-to advice for most businesses is a monthly review of your Profit & Loss and Cash Flow statements. Think of it as a regular health check-up. It gives you a consistent pulse on your business, helping you spot problems before they get big.
For the Balance Sheet, looking at it once a quarter is usually fine. It’s a snapshot in time, so you don’t need to look at it every day. However, this isn't a one-size-fits-all rule. If you run a business with tight profits, like a restaurant or retail shop, you need to watch your cash much more closely. For those businesses, a weekly or even daily cash check-in isn't just a good idea—it's a survival tactic.
What Is the Most Important Report for a New Business?
For any new business, the Cash Flow Statement is the most important report, without a doubt. I’ve seen so many companies that were profitable on paper go out of business simply because they ran out of cash to pay their bills, staff, and suppliers.
Think of your Cash Flow Statement as your survival guide. It shows you exactly how much cash you have, where it’s coming from, and where it’s going. If you’re only going to master one report when you’re starting out, make it this one.
The most common reason a new business fails isn't a lack of profit—it's running out of cash. Focusing on your cash flow statement from day one is the single best thing you can do to protect your business.
Can I Just Use Software for My Financial Reporting?
Of course. Using accounting software like QuickBooks or Xero is a great way to automate your reports. It can save a huge amount of time and make the whole process easier.
But here’s the catch I see all the time: your reports are only as good as the information you put in. If you put bad data in, you'll get bad data out. If transactions are put in the wrong category or sales are entered incorrectly, your reports will be misleading and could cause you to make bad decisions.
Many business owners find that while software creates the reports, they still need an expert to make sure the data is right. More importantly, they need someone who can help them understand what the numbers actually mean and turn that information into a smart plan. This is where professional financial reporting for small business becomes a real game-changer.
Ready to stop guessing and get real clarity on your numbers? The team at MyOfficeOps can handle your bookkeeping, create clear financial reports, and provide the expert guidance you need to grow with confidence. Let us manage the numbers so you can focus on running your business. Schedule your free discovery call today.