
You're probably here because your numbers are doing something annoying.
Sales look decent. Maybe even strong. But cash still feels tight. You open your profit and loss statement, then your balance sheet, and somehow you end up with more questions than answers. Are you making money, or just moving money around? Is the business healthy, or are you one rough month away from stress?
That confusion is normal. Most owners don't need more reports. They need a way to read the story inside the reports.
That's what ratio analysis does. It takes the raw numbers in your financial statements and turns them into signals you can use. Think of it as the difference between staring at a pile of car parts and reading the dashboard while you drive. One gives you data. The other tells you whether to keep going, slow down, or pull over.
If your business depends on contracts, retainers, or subscriptions, this gets even more useful because the timing of revenue can distort what you see month to month. That's why it also helps to spend time understanding recurring revenue, especially if your sales don't land in one clean lump at the point of delivery.
A lot of owners also mix up ratios with KPIs. They overlap, but they're not the same thing. Ratios help you judge financial health. KPIs track performance across the business. If you want the broader operating view, this guide to small business KPIs that actually matter is a useful companion.
Your Financials Are Talking Are You Listening
A business owner I know described it like this. “I'm working harder, billing more, and still don't feel in control.” That's the exact problem ratio analysis helps solve.
Raw numbers can hide the truth. Revenue going up sounds great, but it doesn't automatically mean the business is stronger. You might be waiting too long to collect invoices. You might be carrying too much debt. You might be earning less on each job than you think.
Why reports alone don't answer the real questions
A profit and loss statement tells you what happened. A balance sheet shows what you own and owe. Useful, yes. But on their own, they don't tell you whether the business is stable, efficient, or stretched too thin.
That's where owners get stuck. They can see the ingredients, but not the pattern.
You don't need more accounting language. You need a plain-English way to answer, “Are we okay?”
Ratio analysis gives you that. It compares one financial number to another so you can judge performance in context. Instead of just seeing expenses, you can ask whether those expenses are squeezing margins. Instead of just seeing receivables, you can ask whether collections are slowing your cash flow.
What owners actually want to know
Most small business owners aren't asking for textbook formulas. They're asking practical questions like these:
- Can we pay our bills on time? That's a liquidity question.
- Are we really making money, or just staying busy? That's a profitability question.
- Are we carrying too much debt? That's a solvency question.
- Are we using our inventory, assets, or receivables well? That's an efficiency question.
If you can answer those four questions clearly, you'll make better decisions on hiring, pricing, equipment, and growth.
What Is Ratio Analysis Really
The simplest answer to what is ratio analysis is this. It's a way to turn your financial statements into a dashboard.
Your revenue is like speed on a car. It tells you how fast you're moving. But speed alone doesn't tell you if the engine is overheating or if you're about to run out of gas. You need more gauges than that.

Ratios turn raw numbers into useful signals
Here's the core idea. You take one number from your financial statements and divide it by another. That creates a ratio. The ratio gives context.
A business with a certain profit amount might look healthy at first glance. But that number means very different things depending on the size of the company, the debt load, and the cash position. Ratio analysis fixes that context problem.
As explained in this overview of financial statement analysis, the true value of the numbers isn't in listing them. It's in interpreting how they relate to each other.
A strong summary from EBSCO's ratio analysis explainer puts it well: ratio analysis functions as a quantitative diagnostic tool that transforms absolute financial figures into relational metrics, eliminating the comparability problem in raw data. The same source notes that the Current Ratio uses current assets divided by current liabilities, and a value below 1.0 indicates the business can't cover immediate obligations.
Why this matters in plain English
Let's keep it simple.
If you tell me your business made a profit, I still don't know much. Was that profit earned with very little equity, which could be strong? Or did it take a huge asset base and a lot of borrowed money to get there, which could point to trouble?
Ratios help answer things raw totals can't.
- Liquidity ratios tell you if you can handle near-term bills.
- Profitability ratios show whether your sales are producing real earnings.
- Solvency ratios reveal how dependent you are on debt.
- Efficiency ratios show whether operations are moving cleanly or getting bogged down.
Practical rule: Never judge a business by revenue alone. Revenue tells you size. Ratios tell you health.
This isn't a new idea, by the way. Ratio analysis has been a core financial tool for a long time, and it became a formal system in the DuPont framework around 1919, where return on investment was broken into profit margin, asset turnover, and debt financing through a hierarchy of linked ratios, as described in this historical review on JSTOR. That old framework still matters because the logic is the same today. One number rarely tells the truth by itself.
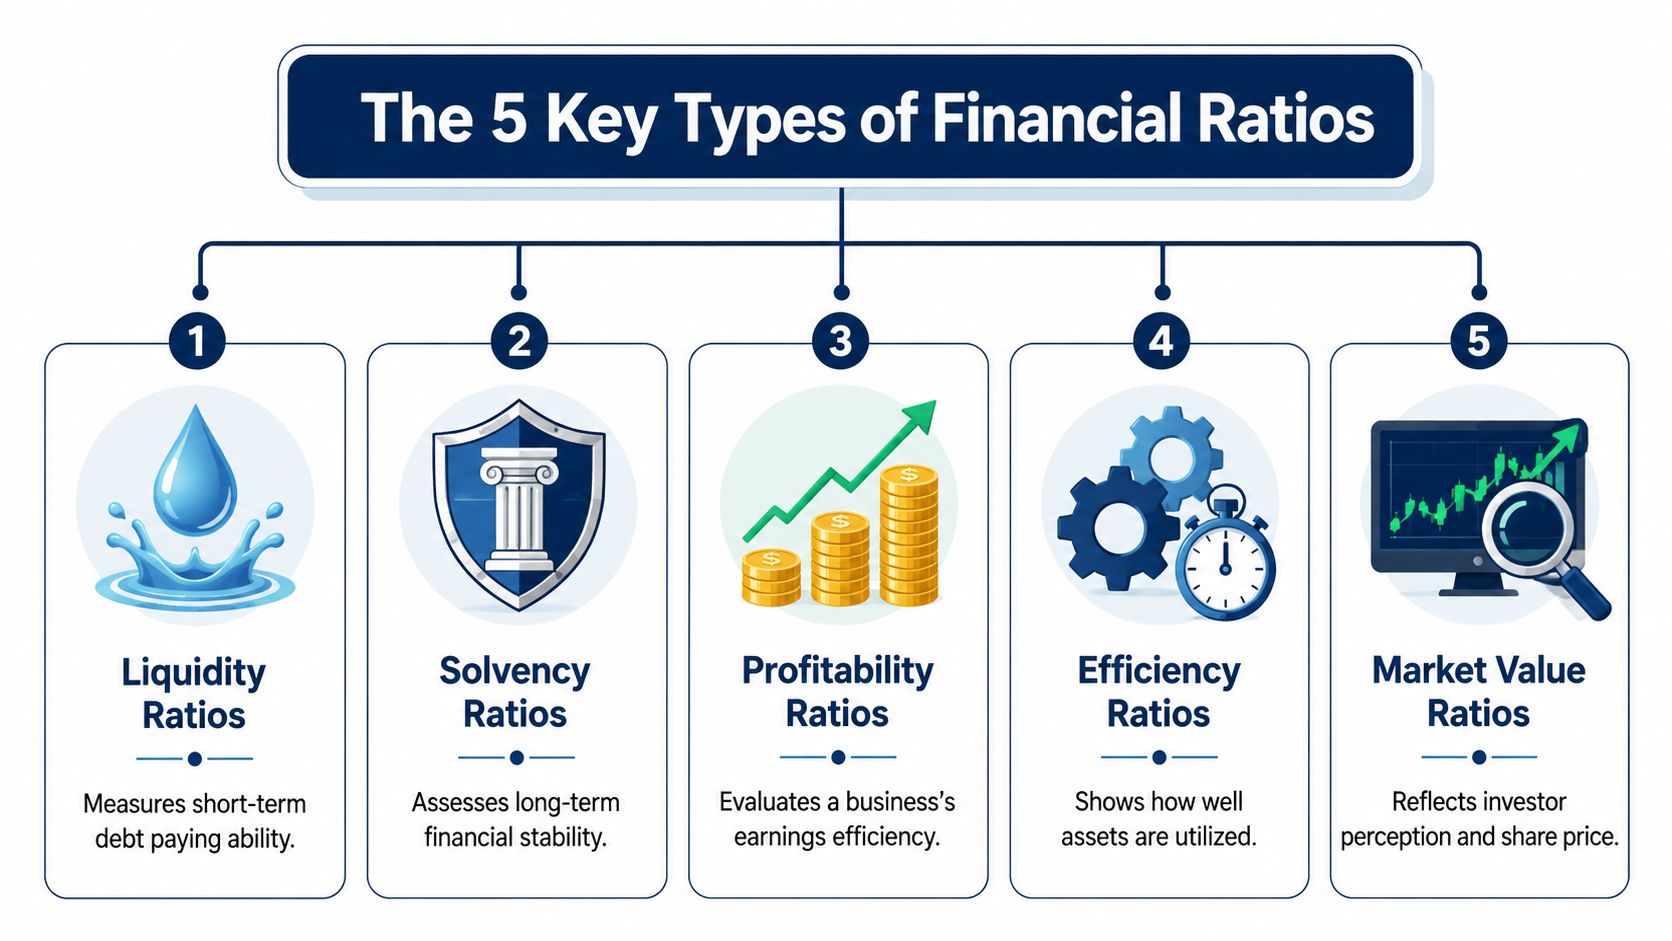
The 5 Key Types of Financial Ratios
There are a lot of formulas out there, but most of them fit into five buckets. If you remember the question each bucket answers, you won't get lost.
Liquidity ratios
This category answers one blunt question. Can we pay the bills coming due soon?
The best-known example is the Current Ratio. It compares current assets to current liabilities. If that number is weak, you may feel profitable on paper and still be cash stressed in real life.
For many small businesses, this is the first warning light to watch.
Profitability ratios
This category asks, Are we earning enough from the work we do?
Examples include Gross Profit Margin and Return on Equity. Gross margin helps you see whether your pricing and direct costs make sense. Return on Equity looks at net income compared with shareholder equity and shows earning power relative to the owners' stake.
If sales are rising but profitability ratios are flat or falling, growth may be covering up a pricing or cost problem.
Solvency ratios
This one gets at a harder question. How much of this business is built on debt?
The classic measure is the Debt-to-Equity ratio. It compares total debts with shareholder equity. That tells you how much borrowed capital is being employed.
Debt isn't always bad. But too much debt reduces room to breathe. It can also limit your options when you want financing, expansion, or a clean exit later.
Efficiency ratios
Efficiency ratios ask, How well are we using what we already have?
Tools include Inventory Turnover and Accounts Receivable Turnover. Inventory Turnover measures how quickly inventory is sold. Accounts Receivable Turnover helps you judge how fast customers pay.
If you run a product business, slow inventory can tie up cash. If you run a service business, weak receivables turnover can create a cash crunch even when sales look fine. If you want a deeper look at collections specifically, this breakdown of accounts receivable turnover is worth reading.
Market value ratios
These ratios matter most when investors, buyers, or outside markets are evaluating the company. The question here is, How does the market value us?
A lot of privately held small businesses won't focus on this every month. Still, it matters if you're raising money, planning a sale, or thinking about long-term enterprise value.
According to Allianz Trade's overview of financial ratios, ratio analysis falls into five strategic domains: liquidity, solvency, efficiency, profitability, and market value. The same source points out that efficiency ratios such as inventory turnover help show operational velocity, and that tracking these areas over time can support exit strategy preparation and valuation decisions.
A ratio category is useful because of the question it answers, not because the formula looks impressive.
Here's the smart way to use them:
- Start with liquidity if cash feels tight.
- Move to profitability if revenue is up but profit feels disappointing.
- Check solvency before taking on more debt.
- Use efficiency when operations feel messy or slow.
- Look at market value when ownership, funding, or exit planning is on the table.
Ratio Analysis in Action A Simple Example
Let's make this real with a simple fictional company called Philly Pro Painters.
They're busy, crews are booked, and the owner feels like things are going well. But the bank balance keeps bouncing around, and he wants to know whether the business is healthy or just busy. That's a perfect time to use ratio analysis.
Philly Pro Painters simplified financials
The numbers below are small on purpose so the math is easy to follow.
| Item | Amount |
|---|---|
| Revenue | $120,000 |
| Cost of Goods Sold | $72,000 |
| Net Income | $12,000 |
| Current Assets | $20,000 |
| Current Liabilities | $10,000 |
| Total Debts | $18,000 |
| Shareholder Equity | $22,000 |
| Average Inventory | $6,000 |
The data you need for these ratios usually comes from the income statement and balance sheet. That's the core point behind Bill's overview of ratio analysis, which also highlights the Current Ratio, Return on Equity, and Debt-to-Equity ratio as key measures.
Ratio one, can they pay near-term bills
Start with the Current Ratio.
Formula: current assets ÷ current liabilities
For Philly Pro Painters:
$20,000 ÷ $10,000 = 2.0
Plain English meaning: for every $1 of bills due soon, the business has $2 in current assets.
That's a comfortable position. It doesn't mean cash management is perfect, but it does suggest the company can cover near-term obligations.
Ratio two, are the owners getting a good return
Now use Return on Equity.
Formula: net income ÷ shareholder equity
For Philly Pro Painters:
$12,000 ÷ $22,000 = 0.55
In plain English, the business generated $0.55 of net income for every $1 of shareholder equity during the period shown.
That's useful because it shifts the question from “Did we make money?” to “Did we make enough relative to what the owners have invested?” Owners should think this way more often.
A business can be profitable and still underperform if it takes too much owner capital to produce that profit.
Ratio three, how debt-heavy is the business
Next is the Debt-to-Equity ratio.
Formula: total debts ÷ shareholder equity
For Philly Pro Painters:
$18,000 ÷ $22,000 = 0.82
That means the company has $0.82 of debt for every $1 of equity.
This number helps you judge financial structure. A lower ratio usually means less dependence on debt funding. A higher ratio means greater reliance on borrowed funds, which can add risk if cash flow gets choppy.
Ratio four, how efficiently are they moving inventory
Now look at Inventory Turnover.
Formula: cost of goods sold ÷ average inventory
For Philly Pro Painters:
$72,000 ÷ $6,000 = 12
That means inventory turned over 12 times during the period shown.
For a painting business, inventory may include supplies like paint and materials. A stronger turnover number usually suggests the business isn't letting too much cash sit on shelves. If this number were sluggish, it could point to overbuying, poor planning, or materials that aren't moving fast enough.
What the numbers say together
One ratio alone can mislead you. Together, these four tell a much better story.
Here's what Philly Pro Painters appears to have going on:
- Liquidity looks solid. The company can likely cover near-term bills.
- Profitability has to be judged in context. Return on Equity gives the owner a better lens than raw profit alone.
- Debt seems manageable. The business isn't overburdened by its borrowing based on this snapshot.
- Operations look reasonably efficient. Inventory doesn't appear to be dragging cash down.
That's the value of ratio analysis. The owner started with a vague feeling. Now he has a clearer read on cash, profit, debt, and operations.
The main lesson from the example
Don't obsess over perfect math. Focus on better questions.
If the Current Ratio drops, ask what changed in receivables, cash, or payables. If Return on Equity weakens, ask whether margins fell or owner capital rose faster than profits. If Debt-to-Equity climbs, ask whether borrowing is funding smart growth or patching weak cash flow.
That's how ratio analysis helps you run the business. It takes a stack of statements and turns them into decision-making tools.
Beyond the Formulas Interpreting Your Ratios
Calculating a ratio is the easy part. Reading it correctly is where owners usually get tripped up.
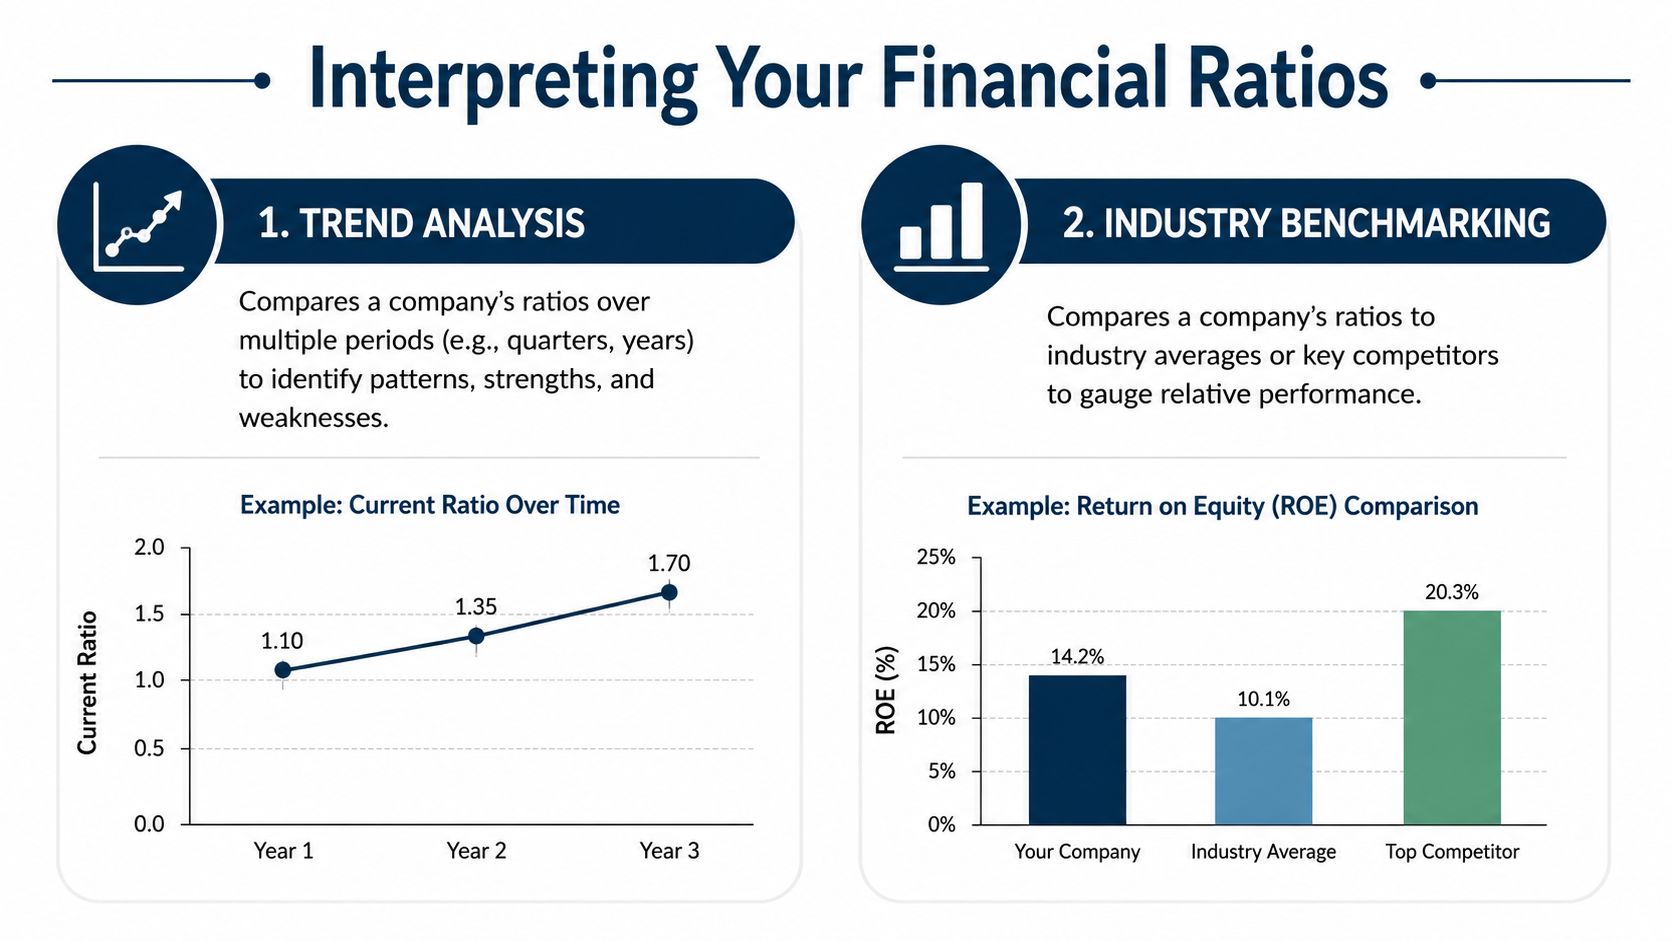
A ratio means almost nothing in isolation. You need context. In practice, that context comes from two places: your own history and the outside market you compete in.
Trend analysis tells you if you're improving
The first comparison should usually be against yourself.
Look at the same ratio over multiple periods. Is your liquidity getting tighter? Is your gross margin drifting down? Are receivables taking longer to collect than they used to? A trend tells a story that one snapshot can't.
Ratio analysis becomes useful for management, not just reporting. It helps you spot direction early.
Benchmarking tells you how you stack up
The second comparison is against peers or industry norms.
That sounds simple until you run a business that doesn't fit neatly into one box. And that's a lot of businesses now. A firm might do IT consulting, managed services, and software implementation all under one roof. Which benchmark should that owner use?
Here's the problem. Data from 2025 shows 72% of SMB professional service firms have multiple revenue streams, but 89% of benchmark databases still use outdated, single-category classifications. The better answer is not to find one “correct” benchmark. It's to build your own weighted benchmark based on how your revenue is split across services.
That matters in lending too. If you're trying to improve SBA loan approval odds, using the wrong benchmark can make a decent business look weaker than it really is.
If your business model is mixed, a one-size-fits-all benchmark will give you one-size-fits-all mistakes.
A simple way to think about a weighted benchmark
You don't need fancy software to grasp the idea.
Try this approach:
- List your revenue streams and note which part of the business each one belongs to.
- Estimate the weight of each stream based on how much revenue it contributes.
- Compare key ratios against a blended view instead of forcing the whole company into one outdated category.
That approach is far more honest for modern service firms than pretending one label explains everything.
Common Pitfalls and Why Your Ratios Might Lie
A bad ratio doesn't always mean a bad business.
That's the part most owners need to hear. Many SMB owners assume the math must be wrong when the result looks ugly. But the issue is often operational timing, not accounting failure.
Good businesses can look weak in a snapshot
Maybe you bought equipment this quarter and paid for it now, while the revenue benefit won't show up until later. Maybe you signed a long client contract and the work is underway, but the revenue recognition hits later than the effort and cost. In both cases, your ratios can look rough even if the business is doing the right things.
That's why context matters more than panic.
The bigger issue is interpretation. Many SMB owners mistakenly blame poor ratios on accounting errors, when the true cause is often structural timing mismatches, such as expensing a large purchase in one quarter, or revenue recognition delays tied to long contracts. The core problem isn't the ratio itself. It's the lack of context for how the business truly operates.
Four common reasons ratios mislead owners
- One-off purchases: A large equipment buy can distort liquidity for a period.
- Revenue timing: Long projects or contract structures can make one month look weaker than the business really is.
- Seasonality: Some companies always look better in one part of the year than another.
- Business model mismatch: Standard interpretations can fail when the company doesn't follow a standard pattern.
Don't ask, “Why is this ratio bad?” Ask, “What business event is this ratio reacting to?”
Use bad numbers as prompts, not verdicts
In this situation, owners either get smarter or get stuck.
A weak ratio should trigger questions. Did collections slow down? Did payroll rise before price increases took effect? Did inventory build ahead of a busy season? Those are management questions. They lead somewhere useful.
A ratio is a snapshot, not a life sentence. If you treat it like a clue instead of a verdict, it becomes one of the most useful tools in your financial toolkit.
Turn Your Ratios into a Roadmap for Growth
The best use of ratio analysis isn't producing prettier reports. It's making better decisions.
Ratios turn fuzzy stress into clear questions. Instead of “I think cash is tight,” you can ask why liquidity is slipping. Instead of “We're busy but profit feels off,” you can ask whether margins, collections, or debt are creating the problem. That shift matters. It moves you from reacting like an overworked owner to thinking like a CEO.

A good advisor doesn't just calculate ratios. They help you decide what to do next. That might mean changing pricing, tightening collections, reviewing hiring plans, or adjusting how you benchmark the business.
If you've been asking what is ratio analysis, the short answer is this. It's a practical way to understand what your financials are trying to tell you. The better answer is this. It gives you a roadmap for smarter choices.
If you want help turning your books into decisions, MyOfficeOps can help. Their team works with small and midsize businesses that need clean financials, clear reporting, and real advisory support on cash flow, profitability, hiring, pricing, and growth.