
Revenue forecasting is the process of estimating future revenue over a set period, usually monthly, quarterly, or annually, using historical data, pipeline activity, and market assumptions. If you're making hiring, pricing, or cash decisions without one, you're guessing with a nicer spreadsheet.
A lot of small business owners get this wrong because they treat it like a finance department task instead of a day-to-day operating tool. Then they wonder why the team is too big, the cash account feels tight, or a “good month” still doesn't solve the next one.
Why Revenue Forecasting Matters More Than You Think
A business owner usually feels the need for a forecast in a simple moment. The shop is busy, the pipeline looks decent, and someone asks whether it is time to hire another project manager, buy equipment, or open a second location. Without a forecast, that decision turns into a gut call, and gut calls get expensive fast.
Revenue forecasting is a structured way to answer a plain question, “What money is likely to come in, and when?” It uses past revenue, current pipeline activity, and market conditions to estimate future income over a defined period. For many businesses, the value is not the number itself, it is what the number lets you do next.
Why owners should care
This is not a finance-only exercise. A forecast should drive hiring, pricing, cash-flow planning, and profitability decisions, which is why it matters so much to small and midsize firms. If a founder knows revenue is likely to flatten next quarter, they can slow hiring, protect cash, and avoid locking into costs they cannot support.
The opposite is flying blind. That looks fine right up until payroll, vendor bills, and debt payments start landing at the same time. Then the business is forced to react instead of plan.
Practical rule: If a decision changes fixed costs, tie it to a revenue forecast, not a feeling.
Good forecasting also shows where growth comes from, and that depends on the business model. A project-based firm needs to know what is booked, what can still slip, and how much work can be delivered. A subscription business needs a clear view of renewals, upgrades, churn, and account expansion. A usage-based model lives and dies on activity levels, so a slowdown in customer consumption can hit revenue before anyone sees it in a headline sales number.
That is why forecasts belong in operating meetings, not just finance reviews. If revenue is tied to hiring plans, cash reserves, and delivery capacity, owners make cleaner calls on when to add staff, when to hold back, and when to push sales harder. A forecast does not remove uncertainty. It gives you a better way to price it in.
Four Forecasting Methods Compared
A project-based agency, a subscription business, and a usage-based company can all report revenue cleanly and still need very different forecasts. The right method follows the way money comes in, so the forecast helps with hiring, cash flow, and delivery decisions instead of sitting in a spreadsheet nobody trusts.
The four common methods
Top-down forecasting starts with market size, expected share, and broad assumptions, then works toward a revenue estimate. It is fast and useful for setting an overall target, but it can drift away from what the team can sell or deliver.
Bottoms-up forecasting starts with the work already in motion. That means booked deals, proposals, billable hours, scheduled appointments, or units expected to sell, then rolling those inputs into revenue. It fits businesses with a clear pipeline, but it fails fast if the underlying data is messy or incomplete.
Historical trend forecasting looks at past revenue and uses that pattern to project forward. It works well in steady businesses with repeat demand, and it lines up with time-series methods such as ARIMA and SARIMA when seasonality matters. Once pricing, customer mix, or the operating model shifts, old trends can mislead you.
Rolling forecasts keep the plan current. Instead of freezing one number for the whole year, you update the forecast on a regular cycle so it reflects fresh bookings, churn, demand changes, and cash pressure. If you want a plain-English explanation of what a rolling forecast is, that is the right place to start.
| Method | How It Works | Best For | Key Limitation |
|---|---|---|---|
| Top-down | Starts with market size and broad assumptions | Early-stage planning, high-level goal setting | Can ignore real sales capacity |
| Bottoms-up | Builds from deals, bookings, hours, or units | Service firms, project work, active pipelines | Only as good as the input data |
| Historical trend | Projects from prior revenue patterns | Stable businesses with repeat demand | Misses recent business model changes |
| Rolling forecast | Updates the forecast on a regular cycle | Owners who need current decision-making data | Requires discipline and monthly review |
A smart forecast usually blends two methods. A bottoms-up model shows what sales and operations believe can close, while a historical trend model catches seasonality and drift that a busy team may miss. That matters even more once you track the right business drivers, including what counts as a marketing KPI, because revenue rarely moves in isolation. Used together, the methods expose weak assumptions before they turn into cash problems.
The Data and KPIs You Need Before You Start
A forecast built on weak data can look polished and still fail. Clean books are the starting point. If revenue is misclassified, delayed, or incomplete, the forecast just repeats the same mistake in a prettier format. Bookkeeping, accounting, and forecasting have to stay connected.
Start with the right inputs
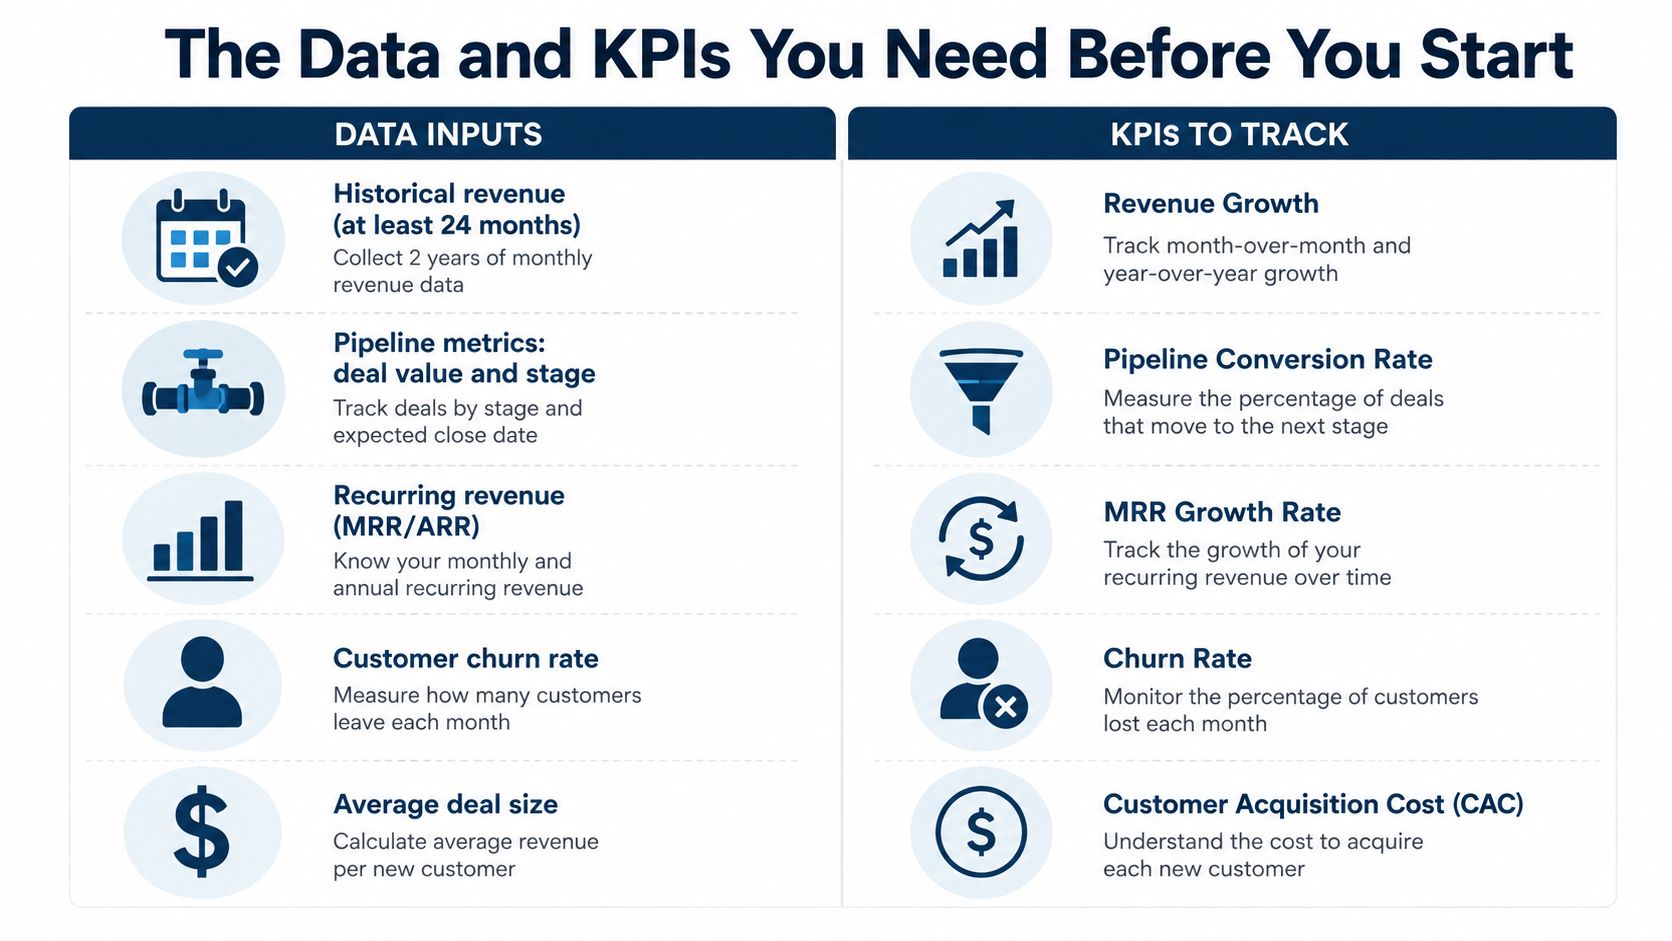
You need historical revenue data. The practical range is at least 12 to 24 months of monthly history, and some teams use 12 to 36 months or more when it is available so seasonal patterns do not get missed. Then add current pipeline activity, expected conversion rates, pricing changes, and outside forces like seasonality and competitor moves.
If you run a subscription business, track recurring revenue by month. If you run a project business, track booked work, project stages, and billing timing. If you run a usage model, separate committed revenue from variable usage so you do not mix two very different things into one number (Oracle).
Track the KPIs that move revenue
The KPIs matter because they explain why revenue changes, not just that it changed. At a minimum, watch average selling price, conversion rates, customer churn, and any recurring revenue measure that fits your model, because revenue forecasts are built from measurable drivers rather than guesswork. If you need a cleaner definition of how to separate the right business metrics from vanity numbers, understanding key performance indicators is a useful companion read, and what counts as a marketing KPI helps keep the marketing side grounded.
Here's the cleanest way to read those numbers:
- Average selling price: Shows what a typical sale is worth.
- Conversion rate: Shows how much of your pipeline becomes revenue.
- Churn: Shows how much recurring business walks out the door.
- Customer behavior: Shows whether customers renew, expand, or slow down.
- Pricing changes: Show whether your revenue per deal is rising or falling.
Use the numbers you already trust before you chase fancy models. A simple forecast built from clean data beats a clever forecast built from messy books.
How Forecasting Works Across Different Industries
A forecast only works when it matches how the business makes money. That's why a law firm, a clinic, a contractor, and a brokerage office need different inputs even if they all want the same thing, a clear view of future revenue.
Professional services, healthcare, construction, and real estate
A marketing agency usually forecasts from proposals, retainers, utilization, and project timing. If a senior account lead is leaving or a big client is renewing late, the forecast should show that risk before payroll does.
A healthcare practice looks more like a flow problem. Appointments, payer mix, no-shows, reimbursement timing, and recurring patient visits all matter. A strong forecast for a clinic doesn't just count booked visits, it tracks when revenue is likely to be recognized and collected.
Construction and trades need a different lens again. Owners should separate signed contracts, job progress, change orders, retainage, and billing schedules. A contractor can have a full backlog and still run short on cash if milestones and collections don't line up.
Real estate firms often forecast from commissions, listings, pending closings, and transaction timing. A brokerage can look busy for weeks and still miss its number if closings slip into the next period. That's why the forecast has to follow the close date, not just the excitement around the deal.
What a good forecast looks like
A good forecast in any of these businesses has one thing in common, it connects revenue to operations. It shows whether the next hire is safe, whether the cash buffer is enough, and whether pricing needs to move now instead of later. It also tells the owner what kind of pressure the business will feel before the month ends.
That's the key point. Forecasting isn't a finance report sitting in a folder. It's the number that tells you whether you can grow without breaking the machine that pays everyone.
Common Forecasting Mistakes That Cost Businesses Money
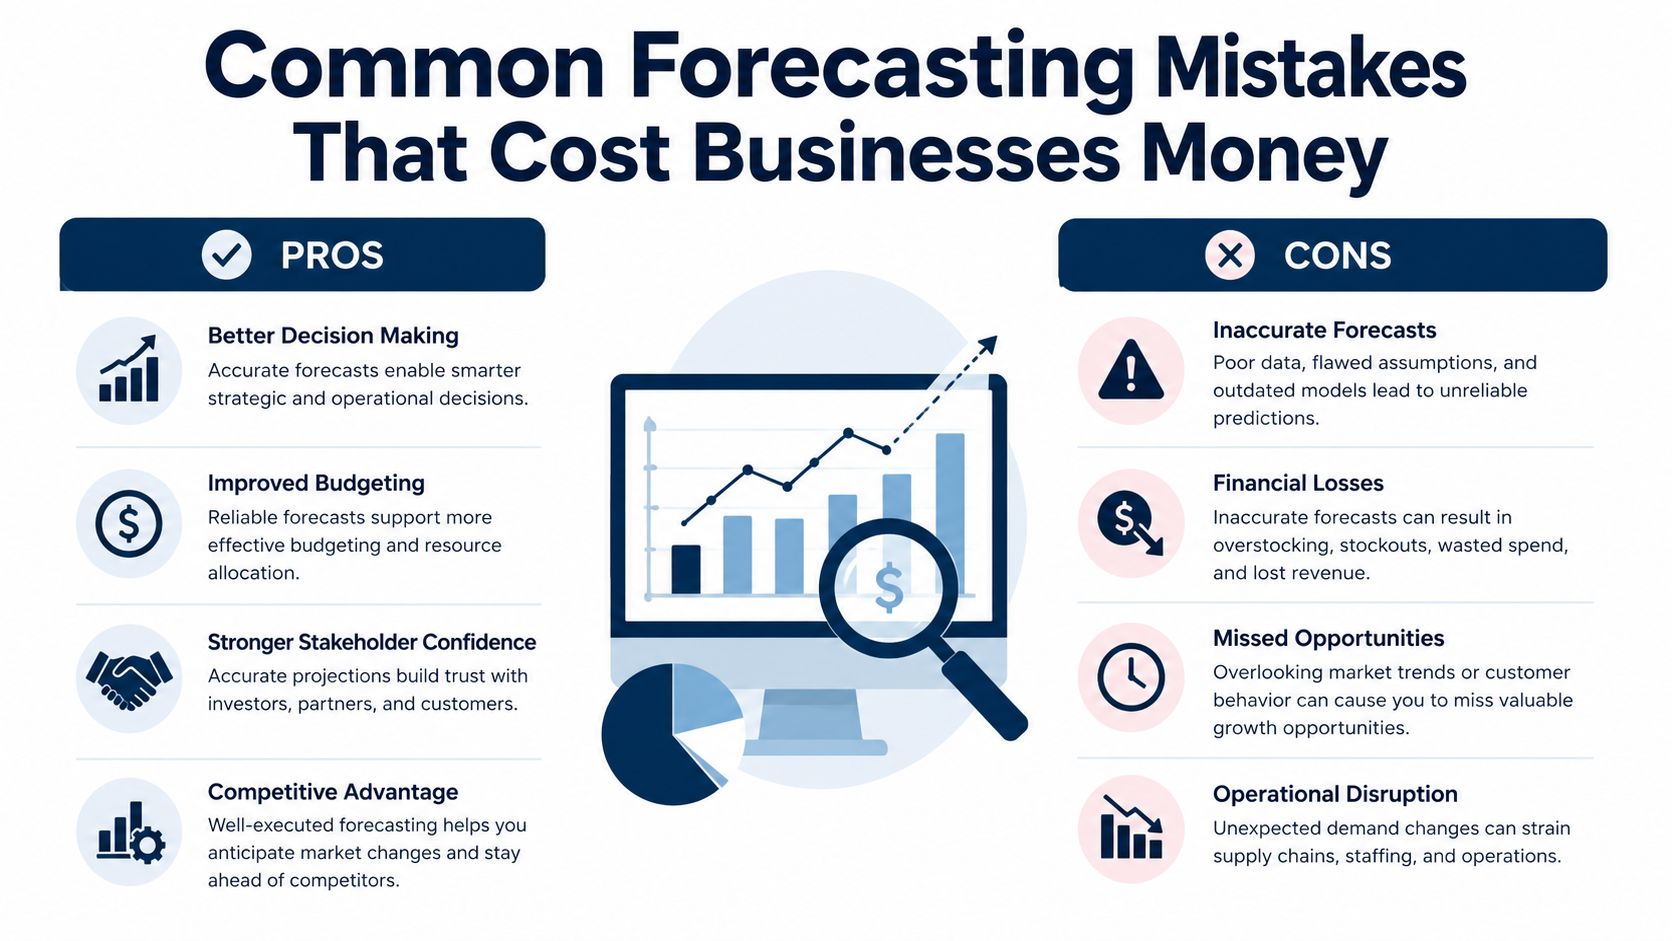
Most forecasting mistakes are plain and that is why they hurt. Nobody sits down and says, “Let's build a false picture of the business.” It happens when the model is too narrow, too optimistic, or built around the wrong revenue timing.
The errors that quietly break the forecast
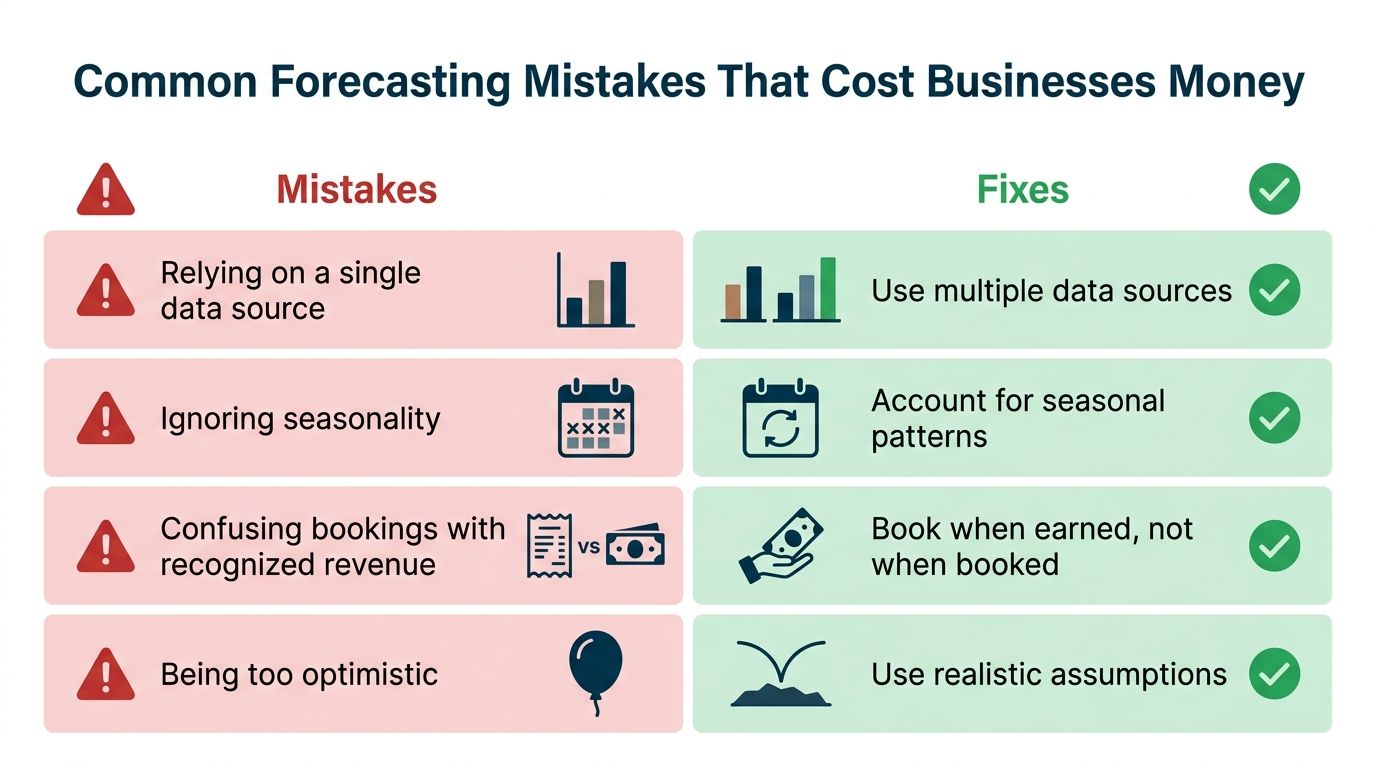
Relying on one source of truth is a common way to get burned. If you only look at CRM deals, you miss billing timing, renewals, collections, and the cash that lands in the bank. The fix is simple, pull from multiple systems, reconcile them, and only then trust the number.
Ignoring seasonality makes a business look stronger or weaker than it really is. A good quarter can hide a soft one later, and a weak month can push owners into cuts they do not need to make. The fix is to use enough monthly history to spot repeat patterns, then build them into the forecast instead of pretending every period behaves the same.
Confusing bookings with recognized revenue leads to bad calls fast. A signed contract is not the same as earned revenue, especially in project-based, subscription, and usage-based businesses where timing drives the outcome. A forecast has to follow when revenue is earned and collected, not just when a customer says yes.
Being too optimistic pushes hiring and spending ahead of reality. Owners do this all the time because hopeful numbers feel better than disciplined ones. The fix is to use assumptions you can defend, then stress-test them against actual results every month.
A weak forecast does not just miss the mark. It can make you hire too early, spend too freely, or keep pricing too low because the business looked healthier on paper than it was in practice.
Failing to segment the business hides the story. A blended forecast can let one product line cover up another that is slipping, which is how owners miss trouble until it shows up in cash flow. Break revenue out by product, customer type, geography, or revenue stream so the weak spots cannot hide inside a blended total.
Treating the forecast as a one-time task is the last mistake that costs real money. A forecast that never gets compared with actual results turns into a story, not a tool. Salesforce's workflow is straightforward, collect the data, build the forecast, then compare it against actual results so the model gets better over time (Salesforce).
Software can help if the basics are already clean. If your categories are messy, start by fixing the plumbing, then use a tool like MyOfficeOps budgeting and forecasting software to keep the process organized instead of adding more confusion.
What happens when these mistakes pile up
The pain shows up in operations, not theory. You hire too early, run cash too tight, or set prices too low because the forecast told you the business could handle it. Then the actual numbers arrive, and you are forced to cut back, delay plans, or explain to the team why the cash is tighter than expected.
Your Practical Roadmap to Building a Revenue Forecast
Start with the books. If your revenue categories are messy, nothing else matters, because bad inputs will keep producing bad answers. Clean accounting gives you the base layer, then the forecast can mean something.
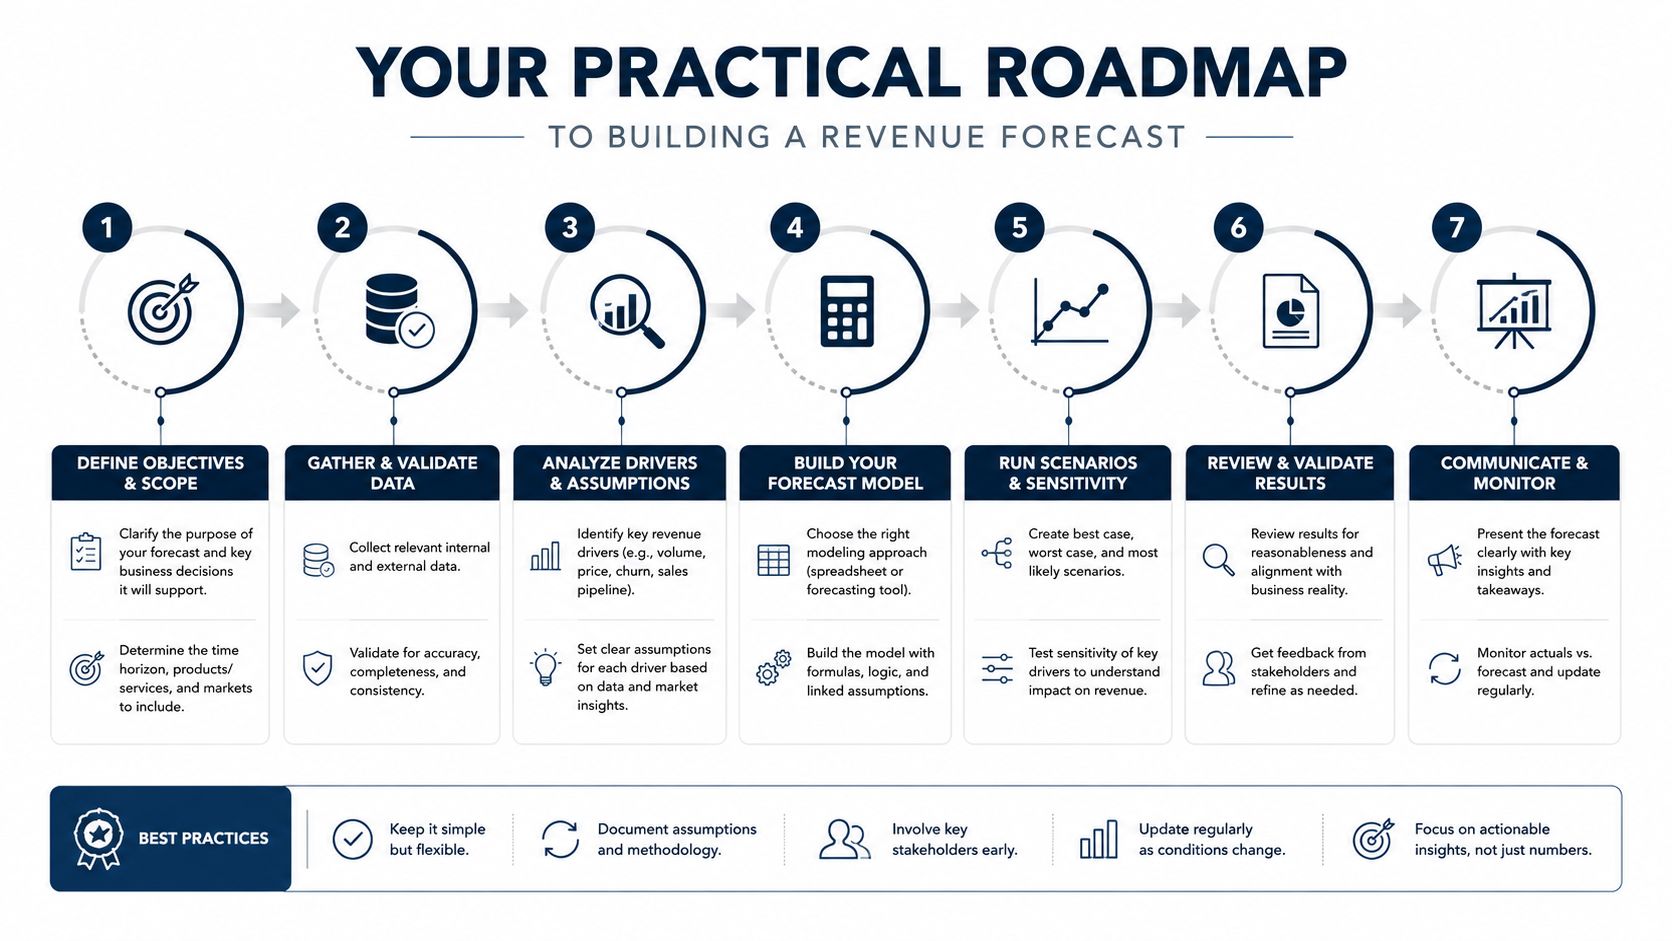
A simple sequence that works
- Clean up your books. Fix coding errors, late entries, and mixed revenue categories first.
- Gather historical data. Pull enough monthly history to see how the business really behaves.
- Identify the drivers. Use the things that move revenue, like deal size, conversion, churn, or billable hours.
- Choose one starting method. Keep it simple at first, then add complexity only when the data supports it.
- Build the first version. Don't wait for perfection. A usable forecast beats a perfect one you never launch.
- Compare it with actuals every month. This is how you catch drift and bad assumptions early.
- Refine the model. Adjust the drivers, assumptions, and segment detail as the business changes.
A lot of owners try to jump straight to software before they've fixed the plumbing. That usually leads to nice dashboards with shaky numbers. Better to start with the data, then let the model grow with the business.
If you want software guidance on that process, budgeting and forecasting software is a sensible place to compare options. MyOfficeOps supports the same workflow through Core Accounting for clean records, Profit Optimization for forecasting and KPI dashboards, and advisory support when the numbers need interpretation.
The engagement path is straightforward, too. A Discovery Call leads into a custom plan, then onboarding, then an ongoing working relationship. That matters because forecasting improves when someone keeps pressure on the assumptions instead of letting the model go stale.
Turning Forecasts Into Smarter Business Decisions
Revenue forecasting isn't about predicting the future perfectly. It's about making better calls today with the information you have. When owners get that right, they hire with more confidence, manage cash earlier, price more fairly, and build a business that's worth more when it's time to sell or transition.
If you want a related view on how predictive thinking is changing business reporting, the AI-driven marketing analytics guide is a useful example of how forward-looking analysis works in practice. The pattern is the same across functions, better inputs lead to better decisions.
MyOfficeOps helps small and midsize businesses turn messy books into clear forecasts, KPI dashboards, and practical monthly decisions. If you want a cleaner view of hiring, cash flow, and profitability, visit MyOfficeOps and start with a Discovery Call.