

You are looking at one profit and loss report for the whole business. Sales look okay. Cash still feels tight. You cannot tell which job, service, or team made money and which one lost it.
That is a common spot for a growing business. Segment reporting helps you split the big report into smaller parts. Then you can see what is working, what is not, and what to fix first.
Why Your Combined P&L Is Hiding the Truth
Mike runs a local contractor company with three kinds of work: HVAC service calls, new installs, and small remodel jobs.
At month end, Mike gets one combined report. Total sales went up, so he feels good at first. Then he looks at the bank account and wonders where the money went.
One report cannot answer his real questions. Are service calls making money after drive time and parts? Are installs priced too low? Is remodel work slow to bill, so cash comes in late? His gut says service is the best part of the business, but the report gives him no way to check.
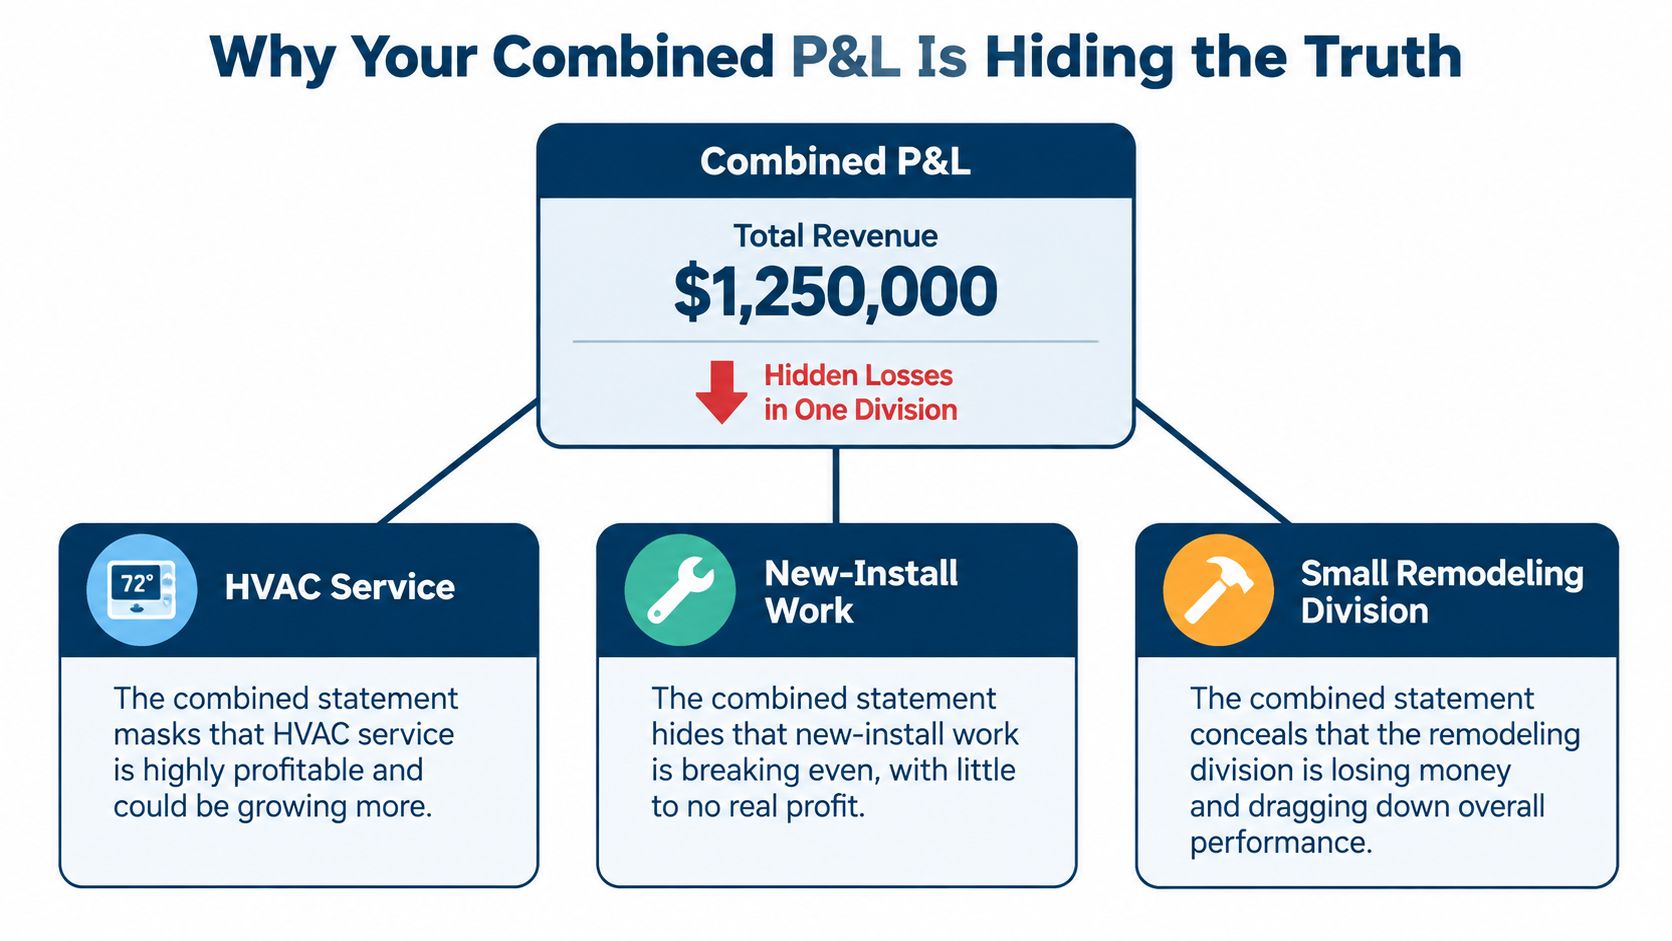
One Big Number Hides Three Small Stories
The three kinds of work do not act the same. Service calls are short and repeat often. Installs need more parts and more planning. Remodel jobs take longer and can change in the middle.
Mixed together, strong service margins can cover losses on remodel labor.
A combined report tells you if the whole boat floats. It does not tell you where the leak is.
Mike cannot see his customers clearly either. Some homeowners call again and again for service. Some remodel clients pay late and ask for many free changes. Both show up as sales, but they are not worth the same to the business.
Hiring gets hard too. Should Mike hire another service tech or another remodel carpenter? Should he raise install prices? Should he stop chasing a kind of job that looks busy but pays poorly?
Once Mike sees each line of work on its own, those questions stop being guesses. He can price installs with confidence, hire where the margin supports it, and spot which remodel jobs drain the cash that service calls bring in. Segment reporting gives him that view, and it earns its keep long before any auditor or buyer asks for it.
What Segment Reporting Actually Means
A pizza shop owner who checks only the nightly register total faces the same problem Mike did, and the fix is easier to see over a counter than over a job schedule. Lunch slices sell fast with few hands on staff, catering quietly eats labor and delivery time, and drinks can out-earn the pizza itself, yet one register total blends all of it into a number that looks fine.
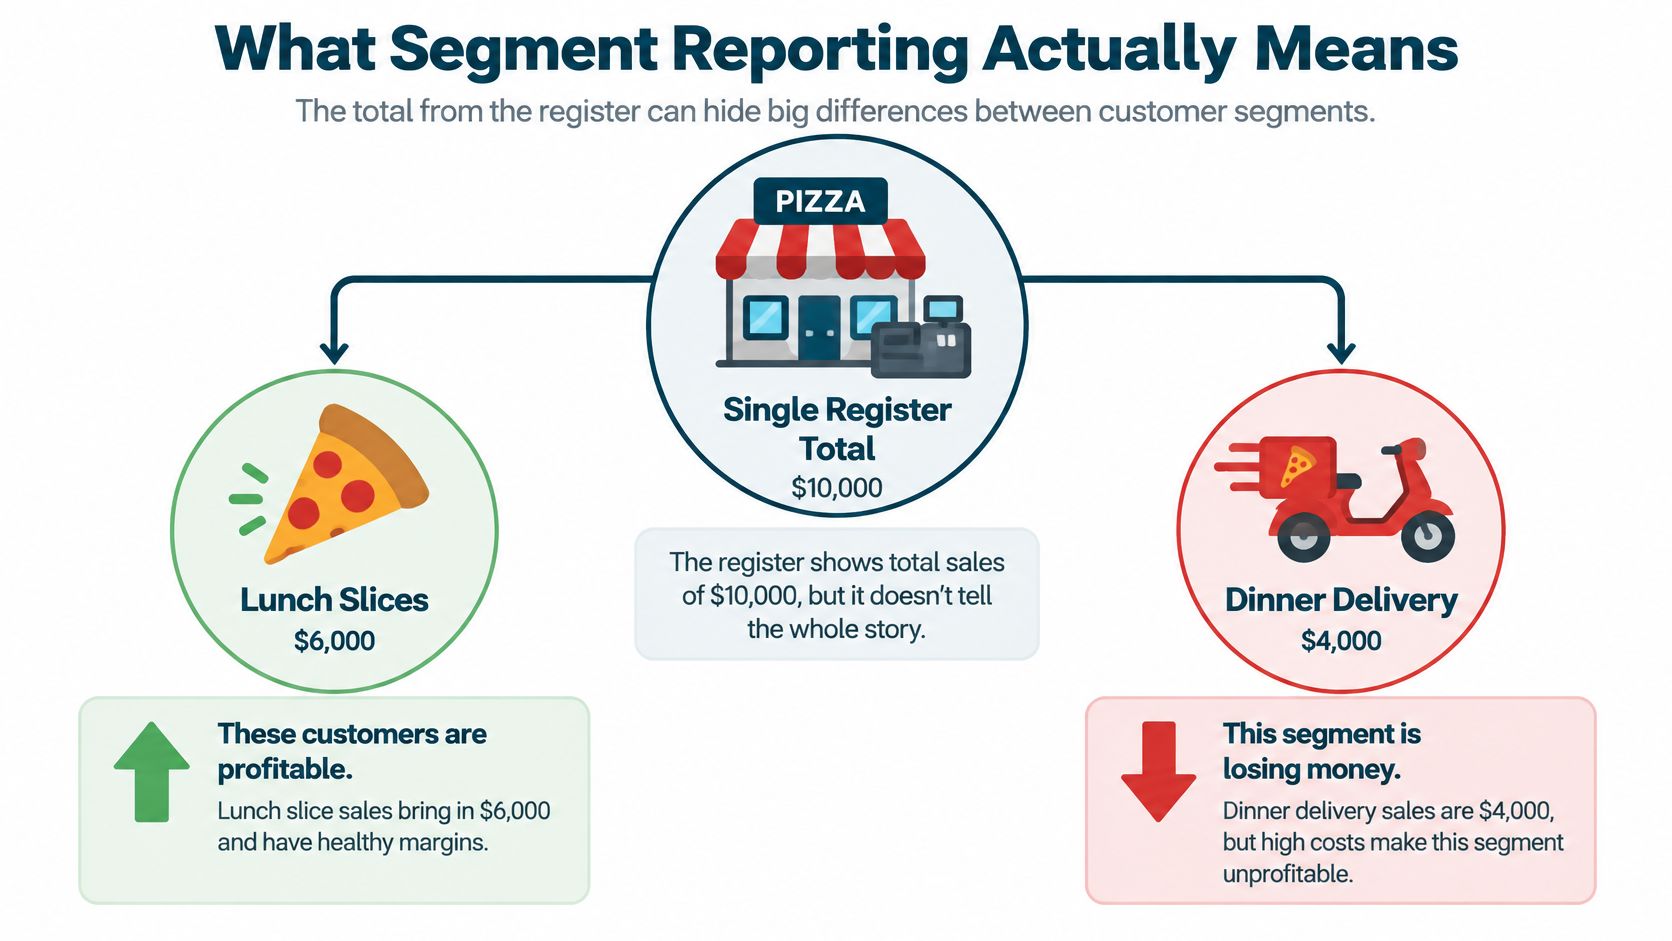
A Simple Way to Say It
A segment is any part of your business you choose to watch on its own. You track its sales and its costs, then use those numbers to decide on price, staff, time, and money.
The formal rules say nearly the same thing. Under IFRS 8, an operating segment is generally a part of a business whose results are regularly reviewed by the chief operating decision maker for resource allocation and performance assessment, as set out in the IFRS 8 standard text on operating segments.
That title sounds like it belongs in a boardroom. Translate it to your shop and it means whoever decides where the money goes next. If you are the one asking how each service line did last month, you are the chief operating decision maker in your own business. The report only needs to match how you already run the place.
Public Company Rule or Shop Tool
Public companies must follow strict rules and share segment numbers with investors. Your business may carry no such duty, and you can still use the same idea at your kitchen table or in a staff meeting.
- Compliance view: You report segments the way a rule says, for investors and audits.
- Operating view: You report segments the way you run the business, so you can price and hire well.
Either view falls apart when costs land in the wrong bucket. Labor, parts, and time have to reach the segment that caused them, and this founder's guide to cost clarity walks through how to tie each cost to the work that created it.
If you can say, "This part made money, that part did not, and here is why," you understand segment reporting. Everything else is detail.
The Standards That Shape the Rules
You do not need to be an accountant to use the main ideas. Two sets of rules shape most segment reports. They sound dry, but their goal is simple. Show the parts. Tie the parts back to the whole.
IFRS 8 in Plain Words
IFRS 8 is used in many countries outside the United States. It follows a management approach. That means segments match how leaders run the business and review results.
For each reportable segment, a company must disclose a measure of profit or loss. It also discloses total assets and liabilities when those amounts are regularly given to the chief operating decision maker.
The report can also include sales to outside customers, sales between segments, interest, wear and tear on assets, taxes, and other big items when leaders review them. IFRS 8 also asks publicly traded companies to share facts about products and services, places they work, and major customers so readers can judge risk, which is explained in the IFRS summary of IFRS 8 operating segments.
One more point matters for small firms. Segment sales, profit, and assets must tie back to the combined totals. If your inside report uses a profit number that differs from your main books, you need a clear bridge between the two.
ASC 280 in Plain Words
ASC 280 is the United States rule for public companies. It also starts with how leaders run the business, but it adds clear size tests.
A segment is usually reported on its own if it reaches at least 10% of combined segment revenue, segment profit or loss, or total segment assets, and meeting just one test is enough under Deloitte guidance on the 10% segment tests.
Say a health company has a clinic that brings in only 8% of revenue but holds 12% of total segment assets. It still counts because it passes the asset test in that same guidance. Sales alone do not tell the full story.
There is also a 75% rule. After the size tests, sales to outside customers from reported segments must cover at least 75% of total outside sales, or the company must add more segments under Deloitte guidance on the 75% test for reportable segments. If reported segments cover only 68%, more must be added.
Updated United States rules apply for annual fiscal years beginning after December 15, 2023, with interim rules for fiscal years beginning after December 15, 2024, as noted in Deloitte's roadmap to segment reporting.
| Element | IFRS 8 | ASC 280 (U.S. GAAP) |
|---|---|---|
| Main idea | Show segments as leaders review them | Show segments as leaders review them |
| Profit measure | Must disclose segment profit or loss | Must disclose segment profit or loss |
| Size tests | Uses reportable segment guidance | Uses the 10% tests cited above |
| Coverage check | Focus stays on clear disclosure | Uses the 75% rule cited above |
| Tie back to totals | Segments must reconcile to combined totals | Segments must reconcile to combined totals |
For a small business, steal the habit, not the paperwork. Pick segments the way you run the firm. Show profit for each one. Make the parts add up to the whole.
How to Decide What Counts as a Segment
Do not start with your chart of accounts. Start with how you talk about the business when money is on the line. That talk usually points to your real segments.
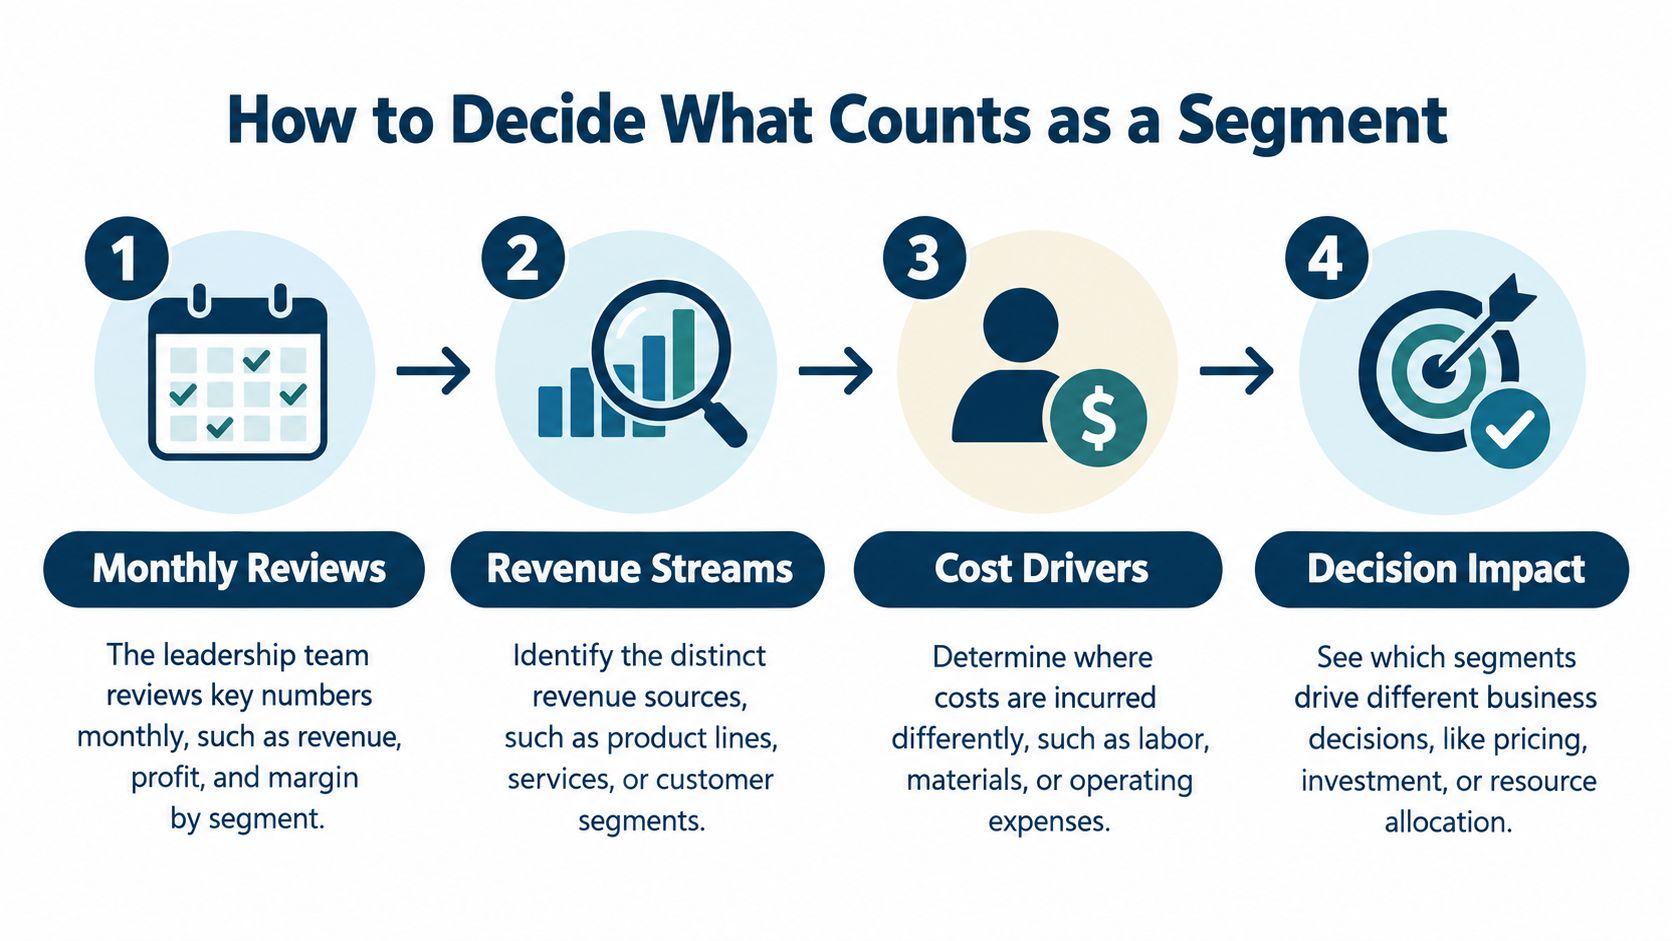
Four Steps You Can Do This Week
1. Look at what you review each month. Write down the numbers you ask for first. A law firm may ask about court cases and flat fee plans. A home health firm may ask about adult care and care for kids. Those are clues.
2. Check if the work acts the same. Group work only if sales, costs, risk, and customers act alike. Court work can be slow, hard to predict, and staff heavy. Flat fee plan work can be faster and more steady. They may look like one firm, but they do not earn money the same way.
That judgment needs care when the business changes. European regulatory commentary expects company specific disclosure of judgments used to identify and aggregate segments, rather than boilerplate text, as discussed in KPMG's summary of ESMA enforcement priorities. In plain words, write down why you grouped things together.
3. Pick a level that is useful, not tiny. Too many segments turn a clear report into noise. Too few hide real gaps. A remodel contractor may split new builds from service calls. Splitting service calls by each truck may be too much at first.
4. Set shared cost rules before you judge profit. Decide how you will treat owner pay, office rent, software, and admin help. Write the rule down and use it the same way each month. If the rule changes each time, no one will trust the report.
Write the reason down: If you cannot explain in one short note why two kinds of work belong together, keep them apart for now.
Try this today. Draw boxes for the main ways you earn money. Under each box, list who buys it, what drives cost, and how cash comes in. If those answers differ a lot, you likely found a segment.
Controllable Margin vs Reconciled Margin
Owners often get stuck here. A team leader wants a fair score for work the team controls. An owner, bank, or buyer wants the full cost of running the whole firm. Both views can be right. They just answer different questions.
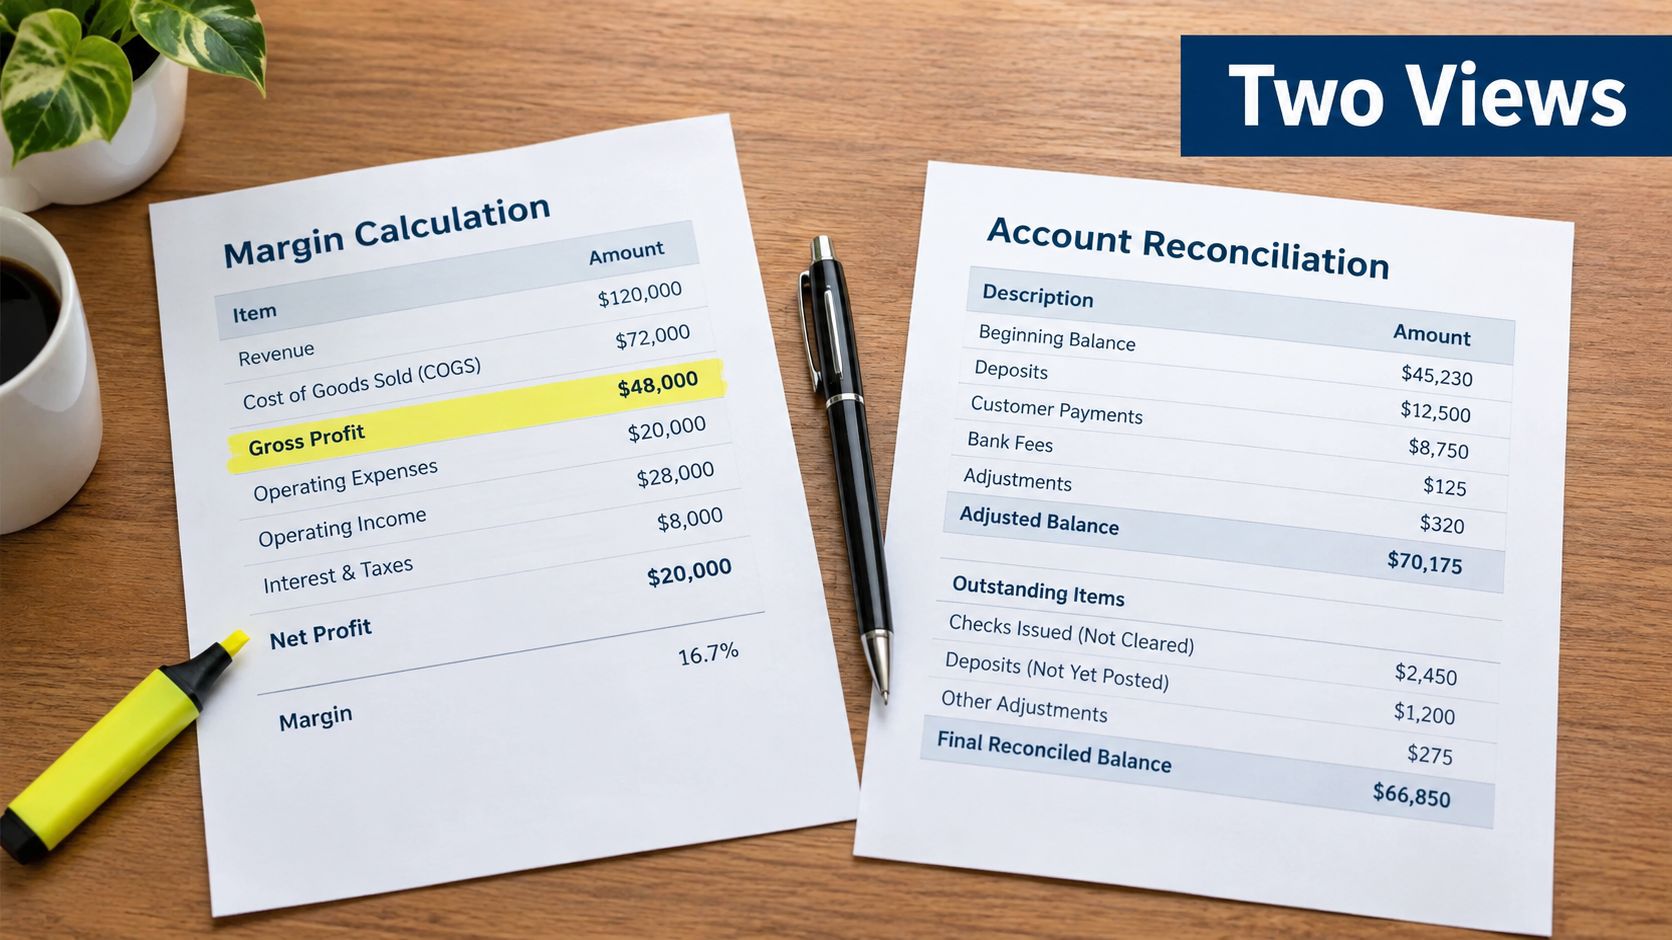
Two Lenses on the Same Work
Controllable margin shows sales minus costs the segment leader can control. That may include direct labor, parts, and tools for that team. It may leave out owner pay, main office costs, and one time deal costs.
This view helps in weekly meetings. A service manager can act on labor time, rework, and parts waste. She cannot act on the owner's pay or the main office lease.
Reconciled margin goes further. It spreads shared costs across segments, then ties back to total profit in the main books. That view is less kind, but it shows if a segment can carry its share of the whole firm.
Shared costs need a clear rule, or the second view turns into a fight. If you need a plain walk through of that step, read this guide to overhead allocation and shared cost rules before you build the report.
A Small Agency Story
A marketing agency thought creative work was its star. Sales were strong, and the team stayed busy. On a controllable view, the work looked great.
Then the owner spread main office payroll, shared software, and her own pay across each service. Creative work still made money, but much less than she thought. A quieter service, monthly care plans, carried more of the firm than she knew.
That changed a hiring choice. She slowed a new creative hire and fixed prices first. She also gave the care plan team more support, since that work paid bills in slow months.
Do not pick only one lens. Show both, side by side, with clear labels. Use the controllable view to coach teams. Use the reconciled view for prices, bank talks, and sale plans.
This dual view also fits where formal rules are heading. IFRS 18 takes effect for annual periods beginning on or after January 1, 2027, and adds rules on management defined performance measures, as set out in FRAS Canada material on IFRS 18 performance measures. Clear labels now will save pain later.
Real-World Wins for Service and Project Businesses
Stories make this real. The firms below are simple examples, but the pattern shows up again and again. Split the work, and the next choice gets clearer.
A Law Firm Finds Its Quiet Earner
A small law firm split court cases from estate plans. Court cases brought big fees and got most of the talk at lunch. Estate plans felt plain and small.
The split told a different story. Court work needed expert costs, long intake time, and fees that often came late. Estate plans were faster, easier to staff, and paid on a clear plan. The plain work funded the firm.
The partners did not drop court work. They raised intake fees, set firmer payment rules, and gave estate plans more room to grow.
A Dental Group Sees Chair Time Clearly
A dental group split hygiene visits, repair work paid by insurance, and cosmetic work. All three filled chairs, so the schedule looked healthy.
The segment view showed cosmetic work helped carry the hygiene schedule. Some repair work lost money once staff time and lab costs were counted, because pay from insurance did not match the time it took.
The owners changed how they booked certain repair visits. They also trained the front desk to explain cosmetic choices better, since patients often asked but staff rushed past it.
A Contractor Smooths Out Cash
A home contractor split HVAC service, new builds, and remodels. New builds and remodels brought big checks, but timing jumped around. Service contracts brought smaller checks that came in steady.
That steady cash helped pay staff between big jobs. Once the owner saw it, he sold service plans with more care and stopped treating them as side work.
Clean job codes made the split possible. Each labor hour and part needed the right job tag, a habit covered well in these construction cost code setup best practices. For project firms, that habit pairs well with a clear guide to project accounting for job based work, since both keep job profit from getting mixed up.
None of these firms needed a fancy system to start. They needed clean tags for sales and direct costs, one shared cost rule, and a monthly talk about what the split showed. The win was not the report. The win was a better price, a better hire, or a service they chose to grow on purpose.
Segment KPIs That Actually Move Decisions
A segment report with only sales and profit is a start, but it is not enough. You need a few numbers that tell you what to do next. Pick ones that fit how each segment earns money.
Numbers Worth Watching Each Month
- Gross margin and contribution margin: These show what is left after direct costs. Use them to test prices and job mix.
- Repeat and recurring sales mix: Steady work helps cash planning. One time work can be great, but it is harder to plan staff around it.
- Cost to win a customer: Ads and sales time should sit with the segment they helped. Do not spread them with no thought.
- Use of paid time: A law or consulting firm may watch billable hours. A contractor may watch job margin. A clinic may watch chair time. Match the number to the work.
- Cash timing: Watch how fast each segment turns work into paid bills. A segment can show profit and still drain cash if clients pay late.
- Repeat rate or loss of clients: This shows if clients stay, come back, or leave after one job.
Watch for traps. Do not average a strong segment with a weak one and call it fine. Do not count the same ad cost in two places. Do not compare segment profit before you decide how shared costs will be shown.
Pick numbers you will act on in the next staff meeting. If a number never changes a choice, drop it from the main page.
A simple dashboard helps if it shows segments side by side and keeps the same rules each month. For ideas on layout, see this profitability dashboard guide for owners and Wistec on data-driven decisions for a plain look at how clear reports shape daily choices.
Start small. Three strong numbers per segment beat a long page no one reads. Review them with the people who can change them, and write down the one action you will take before next month.
Your 30-Day Segment Reporting Starter Plan
Start with how you already talk about the business. Pick two or three parts you mention most, such as service, installs, and remodels, or court work and plan work.
Write a short name and a one line rule for each part. Pull past sales and direct costs into a simple side by side sheet. Do not chase perfect data on day one.
Pick one rule for shared costs and use it each time. Pick three numbers per segment to watch. Put the sheet on your monthly meeting plan and ask what changed, why it changed, and what you will do next.
Keep the same segment names over time. A stable chart helps when a bank, buyer, or new partner asks hard questions later. It also helps you spot real change, not just a new label.
Segment reporting is a habit, not a one time file. Start rough, stay steady, and let the split guide price, hiring, and cash choices.
If your combined report is hiding which service, job, or location makes money, MyOfficeOps can help you build clean books, segment reports, and simple KPI dashboards you can use each month. Our team works with service firms, health practices, and contractors on pricing, hiring, cash flow, and sale readiness, without heavy jargon. Visit MyOfficeOps to book a discovery call and turn your numbers into clear next steps.