

The books tell you what happened last month. They don't tell you whether you can hire another consultant, accept a large construction job, prepare for a slow season, or buy a property without creating a cash problem.
That's where the difference between a budget and a forecast matters. A budget sets spending limits and describes what you plan to do. A forecast updates the likely result as new sales, costs, staffing changes, patient demand, project delays, or financing needs appear. A budget can stay fixed for accountability, while a forecast should change when the facts change.
The right budgeting forecasting techniques depend on how stable your business is, how much useful data you have, and which decision is in front of you. A professional services firm with recurring retainers needs a different starting point from a seasonal construction company or a healthcare clinic with changing patient volume. Each method below explains what it uses, where it fits across professional services, healthcare, construction, and real estate, what it can miss, and how to put it to work without building a model nobody uses.
1. Straight-Line Forecasting
Straight-line forecasting starts with a simple assumption: recent performance will continue at roughly the same level. You take a past average for revenue or expenses and carry it forward. A consulting firm with steady retainer clients might use its average monthly retainer revenue as the starting point for the next planning period. A medical practice with stable patient flow can use the prior period's average operating costs as a baseline.
It's easy to explain, quick to build, and useful when the business has a predictable sales pattern. It also works well for a real estate owner estimating recurring property costs when occupancy and lease terms aren't changing much.

Use it as a baseline, not a verdict
The weakness is that straight-line forecasting can carry old problems into the future. It won't know about a new hire, a price increase, a property renovation, a project delay, or a likely change in patient volume unless you add those assumptions yourself.
Before using the baseline, adjust for changes you already know about. Then review it each month and replace the assumptions when major shifts occur.
Practical rule: Use straight-line forecasting to start the conversation, then layer in seasonality, known commitments, and business drivers before making a major decision.
2. Seasonal Adjustment Forecasting
Many businesses don't earn or spend money evenly throughout the year. A construction company may have more active work during warmer months, while a healthcare clinic may see patient demand change during cold and flu season. An accounting firm may experience a sharp rise in billable work around tax deadlines.
Seasonal adjustment forecasting builds those patterns into the plan. Start with actual monthly revenue and expenses from recent years. Work out what share of the annual total normally falls in each month, then apply those monthly patterns to your new annual expectation.

Make cash flow the main test
Seasonality matters most when bills arrive before the related revenue. A landscaping company may need payroll, equipment maintenance, and materials during a slow period before customer payments arrive. A real estate business may face uneven leasing costs, repairs, or property tax payments even when rental income follows a regular schedule.
Use the method in four steps:
- Collect monthly history: Pull actual revenue and expenses for recent years rather than relying only on annual totals.
- Find the pattern: Calculate each month's share of the annual result.
- Apply the pattern: Spread your new annual forecast across the months using those shares.
- Review business changes: Adjust the pattern if you've added a service, changed locations, or entered a new market.
The method can mislead when the old seasonality no longer reflects the business. A clinic that adds evening appointments or a contractor that shifts into a new project type should revisit its monthly pattern instead of copying it automatically.
3. Percentage of Sales Forecasting
Percentage of sales forecasting works best when a cost follows a measurable activity level. A construction firm can estimate project labor from expected contract revenue, while a digital agency can tie freelancer fees to client work. A healthcare practice can connect clinical supplies to patient visits. Each example needs its own operating assumption, rather than one ratio applied across the business.
Professional services owners can compare payroll with expected billings, then investigate changes caused by hiring, pricing, or lower utilization. The method keeps variable costs aligned with revenue, but it can hide margin pressure if old ratios no longer fit current conditions.
For a practical explanation of how revenue expectations support planning, see this guide to revenue forecasting.
Apply the ratio by cost and business setting
List the costs that should respond to revenue or activity, then calculate their historical relationship over a representative operating period. Set separate assumptions for fixed costs, such as rent, insurance, debt payments, and stable software subscriptions. Review each ratio when staffing, supplier terms, service mix, or pricing changes.
A healthcare clinic may forecast supplies from patient visits while budgeting rent independently. A construction company may link subcontractor fees to awarded work, but retain separate allowances for office overhead. A real estate owner should distinguish property maintenance from loan payments and planned capital work.
Use the historical percentage as a starting point, not a permanent rule. If agency freelancer costs rise faster than client revenue, or project labor consumes more of each construction dollar, examine utilization, pricing, scope changes, and supplier rates. The ratio should expose cost creep and prompt a decision, not replace one.
4. Moving Average Forecasting
A moving average gives more weight to recent business activity than a simple annual average. Instead of using one old period, you average the most recent group of months and move that window forward as new results arrive.
A law firm can use recent billable hours to estimate the next quarter's revenue. A healthcare practice can examine its latest patient visits to see whether demand is rising or falling. A technology services company with recurring subscriptions may use a longer recent window when its customer base is stable.
Choose the window based on change
A shorter window responds faster, but it can overreact to one unusual month. A longer window is steadier, but it may hide a new trend. Start with a six-month average when you need a balance between current momentum and stability. Use a shorter period when the business is changing quickly, and a longer one when results are consistent.
Compare the moving average with your straight-line baseline. If the moving average is moving above the baseline, sales or visits may be gaining momentum. If it falls below, the business may be slowing before the annual accounts make that obvious.
For a construction company, a recent moving average may reflect current bid activity better than older project history. For a real estate business, it can help track recent leasing or occupancy activity, but it shouldn't replace a review of lease expirations and planned vacancies.
Update the calculation each month. The method is most useful when it acts as a current snapshot rather than another figure that gets prepared once and forgotten.
5. Time Series Forecasting
Time series forecasting studies data in its actual order over time. The focus isn't only the average. It's the direction and speed of change. Is revenue rising, falling, or staying flat? Is patient volume building gradually? Are payroll costs increasing as the team grows?
A technology startup may see a clear upward pattern in monthly revenue and use that pattern as one input for planning. A healthcare practice can track patient volume over several periods and decide whether recent growth appears steady enough to support new staff. A professional services firm can review the direction of payroll costs before approving another hire.
Test the story behind the trend
Put the data on a simple graph. A visual often shows a change that a spreadsheet hides. Then calculate the growth or decline between periods and ask whether the cause is likely to continue.
A trend based on a one-time contract shouldn't be treated like recurring demand. A construction company may see a strong period because one large project started, while a real estate business may show unusual revenue because of a property sale. Those events can affect the historical line without creating a repeatable pattern.
Use time series analysis with scenarios rather than assuming momentum lasts forever. You might model continued growth, slower growth, and a flat result, then review the cash and staffing effect of each. Refresh the trend at least when your planning cycle changes, and revisit it sooner when sales, pricing, or market conditions shift.
Financial forecasting works best when the trend informs a decision, not when it becomes a number that everyone accepts without asking what caused it.
6. Incremental Budgeting
Incremental budgeting starts with the current budget, then adjusts it for known changes. It suits owners who need a workable plan quickly and whose operations are relatively stable. The trade-off is that it can preserve outdated spending just because it appeared in last year's budget.
A professional services firm might carry forward its existing payroll plan, then add the cost of a confirmed hire and remove a completed contract. A healthcare practice could retain recurring software and facility costs while updating staffing for expected patient demand. A construction company may keep established office costs but revise project supervision and equipment spending for the jobs already booked. A real estate business can carry forward property management expenses while adjusting maintenance assumptions for its current portfolio.
Challenge each change
Start with the approved budget and mark every increase, reduction, and unchanged line. Tie each adjustment to a specific reason, such as a signed contract, wage change, lease decision, project schedule, or service requirement. Separate committed costs from estimates so an owner can see what remains flexible.
Then compare the revised plan with recent actual results. If a cost has repeatedly exceeded its budget, update the assumption rather than applying the old figure automatically. If spending has fallen because a role, supplier, or property is no longer relevant, remove it.
Incremental budgeting works well as a baseline, while revenue forecasting tests whether the income assumption can support those costs. Use a fresh review for unusual years, major growth, or a change in business model. Owners can combine this baseline with seasonal adjustments or driver-based checks instead of forcing one method to answer every planning question.
7. Regression Analysis Forecasting
Regression analysis looks for a relationship between a financial result and the factors that may drive it. The model might compare marketing spend with new inquiries, sales headcount with closed deals, or submitted construction bids with awarded work.
An IT consulting firm could examine whether adding sales capacity has historically been associated with more closed projects. A professional services firm might compare marketing activity with later client inquiries. A construction company could compare the amount of work bid with the value of projects eventually won.
Start with one relationship
Don't begin with a model packed with every number in the business. Choose one relationship that owners and managers already understand. Gather enough clean monthly observations to see whether the pattern is consistent, then test whether the relationship still makes sense today.
A spreadsheet can handle a basic regression calculation, including through built-in functions in Excel or Google Sheets. The important part isn't the button you press. It's the judgment around the result.
More marketing spend doesn't automatically cause more revenue. A larger sales team may struggle if lead quality falls. More bids may create more work, but only if the firm's win rate and capacity remain healthy. Ask whether another factor explains the result before turning the relationship into a hiring or spending decision.
Have your accountant or bookkeeper review the inputs and logic. Regression is useful when the drivers are measurable and the data is clean. It creates false confidence when the business has changed or the sample contains unusual events.
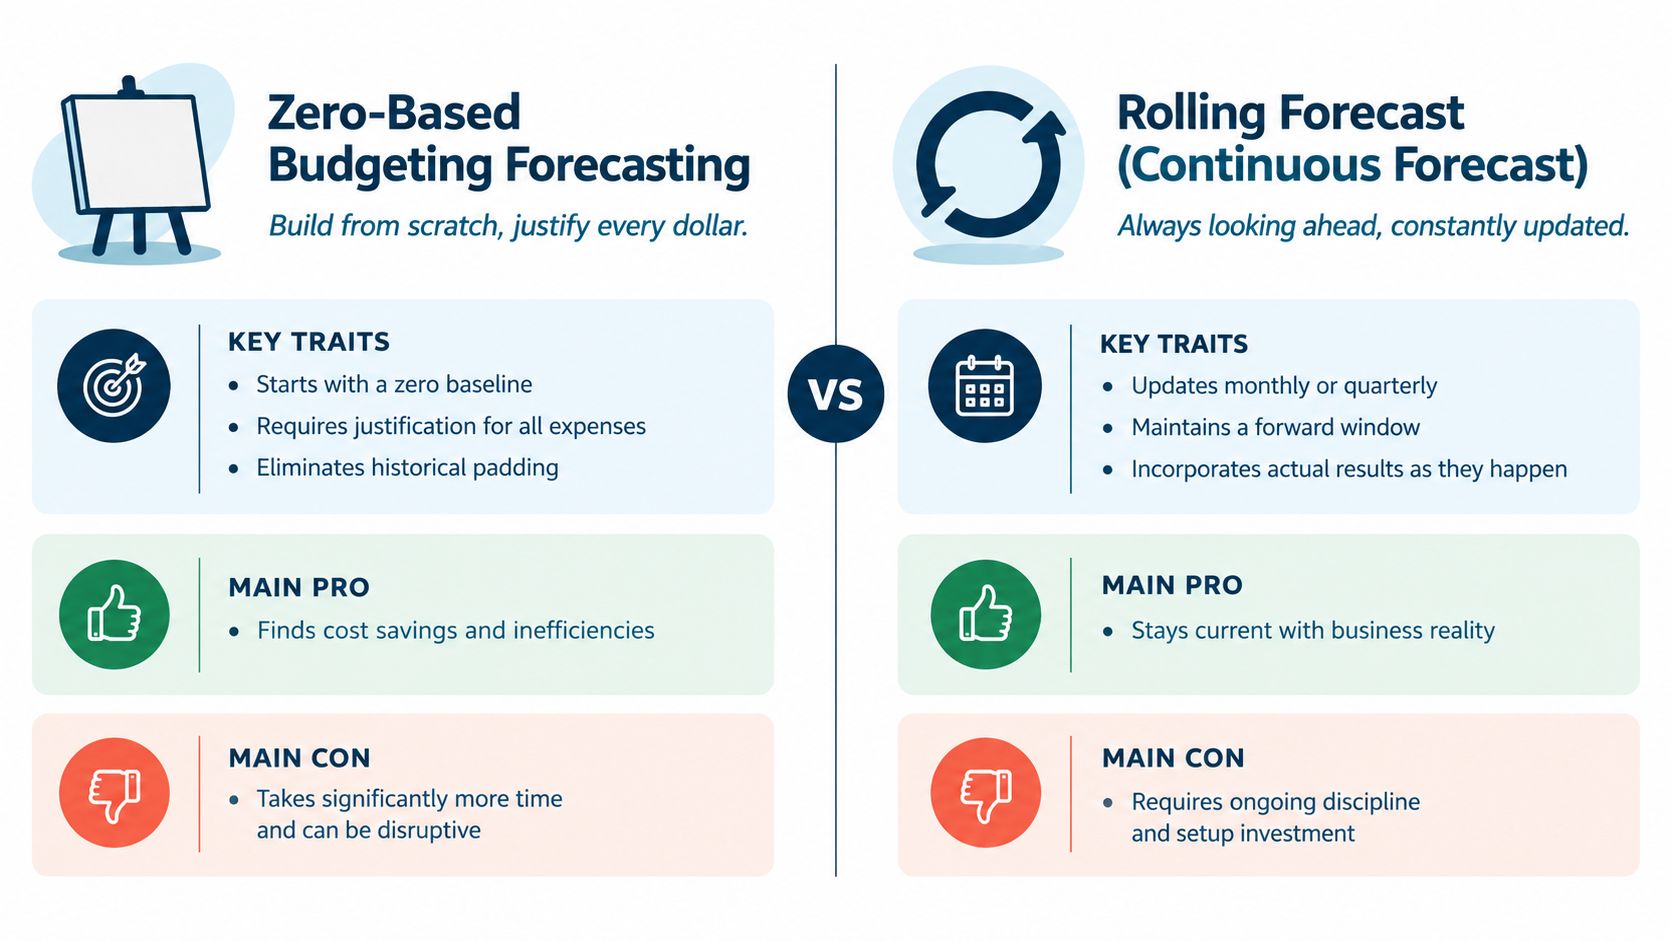
8. Zero-Based Budgeting Forecasting
Zero-based budgeting starts from zero instead of rolling last year's spending forward. Every cost needs a purpose. The method asks what the business needs now, not what it happened to spend before.
A construction contractor can rebuild the plan from expected materials, labor rates, equipment, and overhead for each project type. A healthcare clinic can estimate staffing and supplies from expected patient volume. A professional services firm in a growth phase can ask each department to justify its needs instead of automatically expanding every line.
Apply it where a reset matters
Zero-based budgeting takes more work than incremental budgeting, so it isn't a good fit for every monthly update. It makes more sense during a strategic reset, a margin review, a major change in services, or a period when old spending no longer reflects the business.
Work from essential costs first. Payroll, rent, debt obligations, and basic operating needs come before discretionary programs. Then ask department leaders what they would request if they were starting fresh. Compare those answers with historical spending and investigate large differences.
The method can uncover waste, but it can also cut useful capacity if owners treat every cost as suspicious. A real estate company that removes maintenance spending may create a larger property problem later. A clinic that cuts administrative support may push work onto clinicians. Use the method to connect spending with outcomes, not just to make the total smaller.
9. Rolling Forecast
A rolling forecast keeps the planning window moving. When a month or quarter closes, you add a new future period and remove the period that has passed. The forecast stays current instead of becoming less useful as the year progresses.
A digital agency can update expected client work each month. A professional services firm can replace an older estimate with a new future period as actual results arrive. A healthcare practice can maintain a forward cash view that reflects appointments, payroll pressure, debt payments, and expected seasonal changes. A real estate owner can update rent collections, vacancies, repairs, and financing needs as new information appears.
Rolling forecasts are commonly maintained over a 12- to 18-month horizon, with updates made monthly or quarterly, as described in research on rolling forecasts and variance analysis.
Keep the update small enough to repeat
Set a regular update date. Bring in actual results, revise assumptions, and compare the new forecast with both the budget and the previous forecast. The comparison shows whether the business missed because sales changed, costs moved, timing shifted, or the original assumptions were weak.
The process fails when every update becomes a full annual budget exercise. Use a stable structure, clear owners, and a small set of important assumptions. The point isn't to produce more spreadsheet pages. It's to give the owner a current view before approving a hire, accepting a project, or committing cash to a property.
10. Driver-Based Forecasting
Driver-based forecasting starts with the operating facts that produce the financial results. A law firm may depend on billable hours and average rate. A construction company may depend on project volume, project size, labor cost, and expected margin. A healthcare practice may depend on patient visits, revenue per visit, staffing, and variable supplies.
A consulting firm can forecast revenue from the number of consultants, expected billable hours, and average rate per hour. A real estate business might use occupied units, average rent, lease changes, and maintenance assumptions. The model works from the inside out, rather than beginning with a total revenue number and guessing the lines below it.
Keep the driver list short
Choose the three to five metrics that explain most of the result. Track how each has changed, then forecast each driver using logic that fits the business. Build revenue and cost assumptions from those drivers, and update them when the operating plan changes.
This method is powerful because managers can understand the assumptions. A project manager can challenge the expected project margin. A clinic leader can challenge the patient volume. A service owner can challenge billable capacity. That makes the forecast easier to discuss than a total that appears from a formula.
The trade-off is data discipline. If the business doesn't record projects, hours, visits, occupancy, or rates consistently, driver-based forecasting becomes guesswork with a professional appearance. Budgeting and forecasting software guidance can help organize the process, but no tool can repair unreliable inputs on its own.
11. Scenario Planning
Scenario planning replaces one fragile answer with several possible paths. Build a most-likely case, a best case, and a worst case. Each version should have a clear story about what changes, such as new client wins, fewer construction awards, slower leasing, a key employee departure, or a change in patient demand.
A law firm may model a normal client pipeline, an economic slowdown, and a major new matter. A construction company can test what happens if it wins fewer or more bids than expected. A professional services firm can compare keeping its current team, losing a key person, or adding new hires.
Give every scenario a trigger
A scenario is useful only when it leads to an action. If revenue falls below a defined level, which hire gets delayed? If a project starts late, which payments need to move? If occupancy drops, how much cash remains available for repairs and debt service?
Keep the assumptions plausible and explain what changed between cases. The best case shouldn't be a wish, and the worst case shouldn't be a disaster story with no connection to the business. Use the downside case to examine break-even needs and cash pressure. Review all three cases as new information arrives.
Scenario planning works well alongside rolling and driver-based forecasting. The rolling forecast updates the likely path, while scenarios show how decisions might change if key assumptions move. That's more useful than pretending one forecast can predict every outcome.
11-Method Budgeting & Forecasting Comparison
| Method | Implementation Complexity (🔄) | Resource Requirements (⚡) | Expected Outcomes (⭐📊) | Ideal Use Cases (💡) | Key Advantages (⭐) |
|---|---|---|---|---|---|
| Straight-Line Forecasting | Very low 🔄, simple averages | Minimal ⚡, basic historical totals | Baseline forecast; low precision ⭐ | Small, stable businesses; quick estimates 💡 | Fast to implement; easy to explain ⭐ |
| Seasonal Adjustment Forecasting | Medium 🔄, calculate seasonal indexes | Moderate ⚡, 2–3 years monthly data | Better timing; captures cyclical swings ⭐⭐📊 | Seasonal businesses (retail, landscaping, tax prep) 💡 | Reflects predictable monthly/quarter patterns ⭐ |
| Percentage of Sales Forecasting | Low–Medium 🔄, compute ratios | Low ⚡, historical revenue & expense ratios | Proportional expense scaling; scenario-ready ⭐⭐📊 | Firms where costs move with revenue (agencies, services) 💡 | Keeps expenses aligned to revenue; highlights margin issues ⭐ |
| Moving Average Forecasting | Low 🔄, rolling window averages | Low ⚡, recent periods (3/6/12 months) | Smooths short-term noise; responds to recent change ⭐⭐📊 | Businesses in transition or with recent trend shifts 💡 | Balances recency and stability; simple to update ⭐ |
| Time Series (Trend Analysis) | Medium 🔄, trend/ growth rate calc | Moderate ⚡, consistent chronological data | Captures direction and speed of change ⭐⭐📊 | Growing or declining businesses with steady trends 💡 | Shows momentum; useful for growth pacing ⭐ |
| Regression Analysis Forecasting | High 🔄, statistical modeling | High ⚡, multiple variables, tools, data points | Potentially high accuracy when drivers are valid ⭐⭐⭐📊 | When key drivers are known and measurable 💡 | Reveals cause-effect; strong what‑if capability ⭐ |
| Zero‑Based Budgeting Forecasting | High 🔄, justify every line item | High ⚡, time, cross-dept input | Tight cost control; uncovers waste ⭐⭐📊 | Reorgs, growth planning, cost-cutting initiatives 💡 | Eliminates historical padding; strategic resource use ⭐ |
| Rolling Forecast (Continuous) | Medium–High 🔄, regular updates | Moderate–High ⚡, processes/software, monthly cadence | Continuously current outlook; fewer surprises ⭐⭐⭐📊 | Dynamic businesses needing ongoing visibility 💡 | Keeps plan aligned with reality; early detection of shifts ⭐ |
| Driver‑Based Forecasting | High 🔄, model core metrics | High ⚡, reliable driver data, modeling effort | Actionable forecasts tied to operations ⭐⭐⭐📊 | Complex operations where 3–5 drivers determine outcomes 💡 | Directly links levers to results; excellent scenario planning ⭐ |
| Scenario Planning (Best/Worst/Most Likely) | Medium 🔄, build multiple assumptions | Moderate ⚡, 3+ models, documented assumptions | Range of outcomes; stress-tested plans ⭐⭐📊 | High uncertainty, lender/investor reviews, contingency prep 💡 | Prepares for variance; highlights critical assumptions ⭐ |
Build the Forecast You Will Actually Use
The best budgeting forecasting techniques are the ones your team can update, understand, and use before a decision becomes urgent. A stable professional services firm might start with straight-line forecasting or a moving average. A healthcare practice with changing patient demand may add seasonal adjustment and driver-based planning. A construction company may need project drivers, percentage-of-sales assumptions for variable labor, and scenarios for delayed or lost work. A real estate business may combine recurring income assumptions with vacancy, repair, financing, and property-specific cash flow drivers.
Don't search for one perfect method. Combine simple methods at different layers. Use a straight-line or moving average baseline, add seasonal adjustment when timing affects cash, and use percentage of sales for costs that move with revenue. As hiring, project, financing, or investment decisions become more complex, add driver-based forecasting, rolling updates, and scenario planning.
The method also depends on how you judge usefulness. Forecasting research often focuses on measures such as MAPE, RMSE, and MAE, but a systematic review of 69 peer-reviewed studies found that directional error receives much less attention, even though owners need to know whether the business is heading up, down, or toward a cash-risk point. Read the 2026 review of forecasting evaluation when you want to think beyond average forecast closeness.
A forecast can be statistically close and still give bad advice if it misses the direction of change. A clinic that underestimates a demand drop may hire too early. A contractor that misses rising labor costs may accept work at the wrong margin. A property owner that misses a vacancy risk may commit cash needed for repairs.
Use a simple monthly routine:
- Update actuals: Close the books and replace estimates with real revenue, costs, collections, and cash.
- Review drivers: Check the small set of metrics that explain performance, such as billable hours, visits, project starts, occupancy, rates, and labor.
- Compare views: Review actual results against the budget, the latest forecast, and the prior forecast.
- Explain variances: Write down whether the change came from volume, pricing, timing, mix, cost, or a bad assumption.
- Change assumptions openly: Make the update visible to the people responsible for sales, staffing, delivery, and cash.
Planning has also changed over time. Modern business forecasting developed into a distinct discipline during the Great Depression of the 1930s, then mainframe computers in the 1960s and personal computers in the 1980s made budgeting and model updates faster. By the start of the 2000s, businesses were combining internal transaction data with outside information such as weather, social sentiment, and economic indicators, expanding forecasting beyond accounting alone. IBM's overview of planning, budgeting, and forecasting provides that background.
For small and midsize businesses, the practical lesson is simpler. Clean books come first, the model should match the decision, and every update should help an owner act. MyOfficeOps helps businesses across professional services, healthcare, construction, and real estate turn accounting data into budgets, cash flow forecasts, KPI dashboards, and decisions about pricing, hiring, profitability, and growth. If you're also planning technology capacity around changing demand, this server capacity planning resource offers a related planning perspective.
MyOfficeOps provides bookkeeping, accounting, payroll integration, financial analytics, budgeting, forecasting, KPI dashboards, and CFO-level advisory for small and midsize businesses. Visit MyOfficeOps to turn clean financial data into a forecast you can use for hiring, cash flow, project selection, and growth.