
You're staring at this month's P&L, the tax line is highlighted, and the profit number is barely visible. Revenue looks fine, but the bank balance feels tight. You're asking the question most small-business owners ask at this point: What happened to the money?
That's where income statement analysis earns its keep. A P&L isn't just a tax document or a report your bookkeeper sends after the month is over. Read properly, it tells you whether your prices work, whether labor and supplier costs are under control, whether overhead is growing too fast, and whether the business can support the next hire, equipment purchase, or loan payment.
Why Your P&L Is Actually a Decision Tool
A 20-person business doesn't have room for vague financial reporting. One bad hire, a weak pricing decision, or a supplier cost increase can eat into profit before anyone notices. The income statement gives you an early warning, but only if you use it to make decisions instead of filing it away.
Take a small commercial landscaping company. Sales are rising, so the owner assumes the business is healthy. But the P&L shows that revenue from larger contracts has grown while direct labor and materials have grown faster. Gross profit is getting squeezed, even though the top line looks good. That points to a practical question: are these contracts priced properly, or is the company taking on work that keeps crews busy but produces little return?
Revenue tells you more than whether sales happened. It can show whether customers accept your prices, whether the sales team has enough capacity, and whether recurring work is replacing one-time projects. A service firm with steady recurring revenue has a different planning problem from a firm that depends on a few large annual engagements. The income statement helps you see that difference.
Each line points to a different call
COGS exposes direct delivery risk. If materials, direct labor, freight, or production costs rise, you may need to renegotiate with vendors, change the scope of work, or raise prices. A company can't fix a margin problem by cutting office snacks when the actual issue sits in supplier invoices or underpriced jobs.
Operating expenses show whether the business is scaling sensibly. Payroll, rent, software, sales costs, insurance, and professional fees should support revenue growth. If overhead grows faster than sales, the owner may need to pause hiring, remove unused tools, or redesign a role before adding another person.
Net income answers the bigger ownership questions. Can the company hire? Can it buy equipment? Can it service debt? Can it distribute money without starving working capital? Net income is the final profit after all expenses, including interest and taxes, as explained in the SEC's investor guide to financial statements.
Practical rule: Don't ask whether the P&L looks good. Ask which decision the P&L is forcing you to make.
Monthly reporting also makes the statement forward-looking. One month can contain a late invoice, an annual insurance payment, or a one-time repair. A pattern across months tells you whether the business is improving or steadily losing ground. Expert guidance recommends separating revenue, COGS, operating expenses, and non-operating items, then testing gross, operating, and net margins across periods and segments rather than relying on one snapshot (income statement analysis guidance).
If you want owners or clients to receive financial explanations in a simple, useful format, NewsletterAsAService for CPA firms is one resource worth reviewing. Clear reporting helps people act on the numbers instead of waiting for year-end tax conversations.
Reading the Income Statement Line by Line
Start with the top line, then follow each cost to the bottom. An income statement should show which work creates profit, which expenses consume it, and what you need to change before you hire, reprice, cut costs, or ask a bank for financing.
Revenue is what the business earned during the period under accrual accounting. It is not necessarily cash collected. A service company may recognize revenue when it performs the work, while a product company recognizes it when the sale is recorded. Separate recurring revenue, project revenue, and one-time revenue where possible. They do not support the same hiring plans, pricing decisions, or borrowing capacity.
Assume a service business reports $1.8 million in revenue. That total could combine monthly retainers, project work, and implementation fees. Treating every dollar as equally repeatable can leave an owner overconfident about next quarter.
The middle of the statement shows delivery economics
Suppose direct labor and delivery costs total $720,000. Put those costs in COGS because they connect directly to delivering the service. Gross profit is $1.08 million, calculated as revenue minus COGS. The gross profit and operating profit explanation describes gross profit as the subtotal after cost of sales is deducted from net revenue, with operating profit calculated later after operating expenses and depreciation.
Classify costs consistently. A billable technician's wages may belong in COGS, while a general office administrator's wages usually belong in operating expenses. Set a clear rule for software subscriptions and contractor fees. A contractor performing client work may be a direct cost. A contractor handling general administration should not be buried in delivery costs, because that would make service margins look better than they are.
Assume selling expenses total $180,000, including sales commissions and advertising. Administrative expenses total $360,000, including office payroll, rent, insurance, and software. Operating expenses therefore total $540,000, leaving $540,000 in operating income before non-operating costs. If you are deciding whether to hire, compare the expected role and its full cost with operating income, not with revenue alone.
| Line Item | Amount | Definition | Common SMB Mistake |
|---|---|---|---|
| Revenue | $1,800,000 | Earned sales for the period | Treating invoices or cash collections as the same thing |
| COGS | $720,000 | Direct costs required to deliver work | Burying indirect software, office costs, or unrelated contractors here |
| Gross profit | $1,080,000 | Revenue minus COGS | Looking at the total without checking which services produce it |
| Selling expenses | $180,000 | Costs tied to winning business | Ignoring commissions or counting sales costs as delivery costs |
| Administrative expenses | $360,000 | General costs of running the company | Mixing personal cards, owner costs, and business overhead |
| Operating income | $540,000 | Gross profit minus operating expenses | Assuming growth always improves profitability |
| Depreciation and amortization | Included in operating expenses or shown separately | Allocation of asset and intangible costs over time | Forgetting that the expense reduces profit without being a current cash payment |
| Interest expense | Varies by loan structure | Cost of borrowed money | Treating debt payments as one expense instead of separating principal and interest |
| Income tax expense | Varies by tax position | Tax expense associated with reported profit | Using tax expense as proof of cash available |
| Net income | After all expenses | Final profit after interest and taxes | Treating it as the bank balance |
The basic formula is net income = revenues minus expenses. Follow that flow when deciding whether the business can support a new hire, absorb a price concession, reduce overhead, or service debt. Strong gross profit can still be overwhelmed by excessive overhead, interest, or tax expense.
Accrual accounting records revenue when earned and expenses when incurred. The indirect cash flow method then adjusts net income for non-cash items and working-capital changes, as explained in KPMG's income statement presentation guide. Read the final profit line as a measure of performance, not as the amount sitting in the bank.
Calculating the Three Margins That Matter
Revenue shows scale. Margins show whether each sales dollar supports the work, the overhead, and the owner's next decision.
Use a different example from the basic service business above. A contractor generates $2.4 million in revenue and keeps a 55% gross margin. That produces $1.32 million in gross profit. If operating expenses total $1.08 million, operating income is $240,000. After $60,000 in interest and taxes, net income is $180,000.
Gross margin answers whether the work is worth doing
The contractor's calculation is:
Gross margin = $1.32 million ÷ $2.4 million = 55%
Gross margin measures what remains after the direct costs of delivering the work. That money must cover office staff, sales, rent, technology, debt, taxes, and profit. For an owner, this is the margin that should guide pricing, bids, project mix, and supplier negotiations.
If gross margin falls, check labor hours, subcontractor rates, materials, freight, change orders, discounts, and how costs are assigned to jobs. A pricing concession that looks small at the proposal stage can consume the profit needed to cover overhead. Cut general overhead only after confirming that delivery economics are sound.
A practical SMB reference range for gross margin is 40% to 60%, but it is not a universal target. Industry economics differ widely, and gross margin can vary by more than 40 percentage points across industries, according to peer benchmarking guidance. Compare the result with your own history and with businesses that use a similar delivery model.
Operating margin tests overhead discipline
The contractor's operating margin is:
Operating margin = $240,000 ÷ $2.4 million = 10%
Operating margin shows what remains after the costs required to run the company, before interest and taxes. It gives you a direct test of overhead discipline. A 55% gross margin can still produce a thin operating margin if payroll, facilities, software, insurance, or sales costs have grown too quickly.
A falling operating margin calls for an overhead review. Separate costs that support current revenue from costs hired or purchased ahead of demand. Before adding a project manager or opening another location, confirm that expected gross profit can carry the added cost.
A rising operating margin may reflect better utilization, stronger pricing, or cleaner operations. Confirm which one before assuming the improvement will last.
Net margin shows what can stay in the business
The contractor's net margin is:
Net margin = $180,000 ÷ $2.4 million = 7.5%
The practical SMB reference range is 5% to 12%, although the right comparison depends on the business model and capital structure. Net margin includes interest and income taxes, so it reflects the amount left after the full financial burden is counted.
A low net margin narrows the room for debt service, owner distributions, equipment purchases, and reinvestment. A stronger result creates more choices, but it still does not prove that cash is available. Review the gross profit margin guide for a straightforward explanation of the gross profit calculation.
Use the margin that matches the decision. Gross margin guides pricing and delivery choices. Operating margin supports hiring and overhead decisions. Net margin belongs in debt, distributions, and reinvestment discussions.
Trend Analysis, Vertical Analysis, and Benchmarking
A single P&L can show what happened. It cannot show whether the problem is temporary, structural, or specific to your business model. Use vertical analysis, trend analysis, and benchmarking together, in that order, then tie the result to a decision about pricing, hiring, costs, or financing.
Vertical analysis is the quickest pressure test. Convert each income statement line into a percentage of revenue. If payroll rises from 35% to 42%, the percentage exposes the squeeze even when revenue and payroll dollars both increase. The common revenue base also lets you compare a small month with a large month without confusing growth with improvement.
Trend analysis shows direction over time. Review revenue, COGS, gross profit, operating expenses, operating income, and net income across the monthly history you have. Look for seasonality, pricing drift, and expenses growing faster than sales. One weak month may reflect timing. A persistent gross margin decline calls for a pricing, labor, or delivery decision.
Benchmarking supplies outside context. Compare your results with firms that resemble yours in revenue profile, geography, and business model. Peer selection matters because margin expectations differ by sector. Before reacting to a gap, confirm that both companies classify COGS and overhead consistently. A classification difference can look like a performance problem.
Put all three views in one worksheet
Use last year's P&L alongside this year's monthly actuals. Create a tab for vertical analysis, a tab for monthly trends, and a tab for peer comparisons. Refresh the workbook quarterly. Add a margin bridge that explains changes in price, mix, volume, input costs, freight, labor, rebates, inventory accounting, acquisitions, divestitures, or foreign exchange.
| Analysis Type | Question Answered | Data Needed | Best Used For |
|---|---|---|---|
| Vertical analysis | What share of revenue does each line consume? | One or more P&Ls | Finding the largest cost pressure quickly |
| Trend analysis | Is the business improving or weakening? | Monthly or annual history | Spotting seasonality and margin drift |
| Benchmarking | How does the business compare with similar peers? | Comparable peer data | Testing whether a problem is structural |
Consider a 12-person IT services firm. Vertical analysis shows payroll rising from 35% to 42% of revenue, while trend analysis shows a flat gross margin. That combination points to a staffing or utilization problem, not merely a sales problem. The owner should review billable hours, pricing, and workload before approving another hire. Benchmarking then helps determine whether the cost structure is unusual for comparable firms.
Compare your gross margin with your own history and with 5 to 8 peer firms, then explain the gap before celebrating or correcting it. For a plain-language explanation of the ratios behind these comparisons, read what ratio analysis means.
Use benchmarks to frame questions, not to run the company by universal thresholds. Compare like with like, check whether gross, operating, and net margins point in the same direction, and investigate classification differences before changing prices, cutting staff, or speaking with a bank.
Red Flags Owners Miss Including Cash Versus Profit
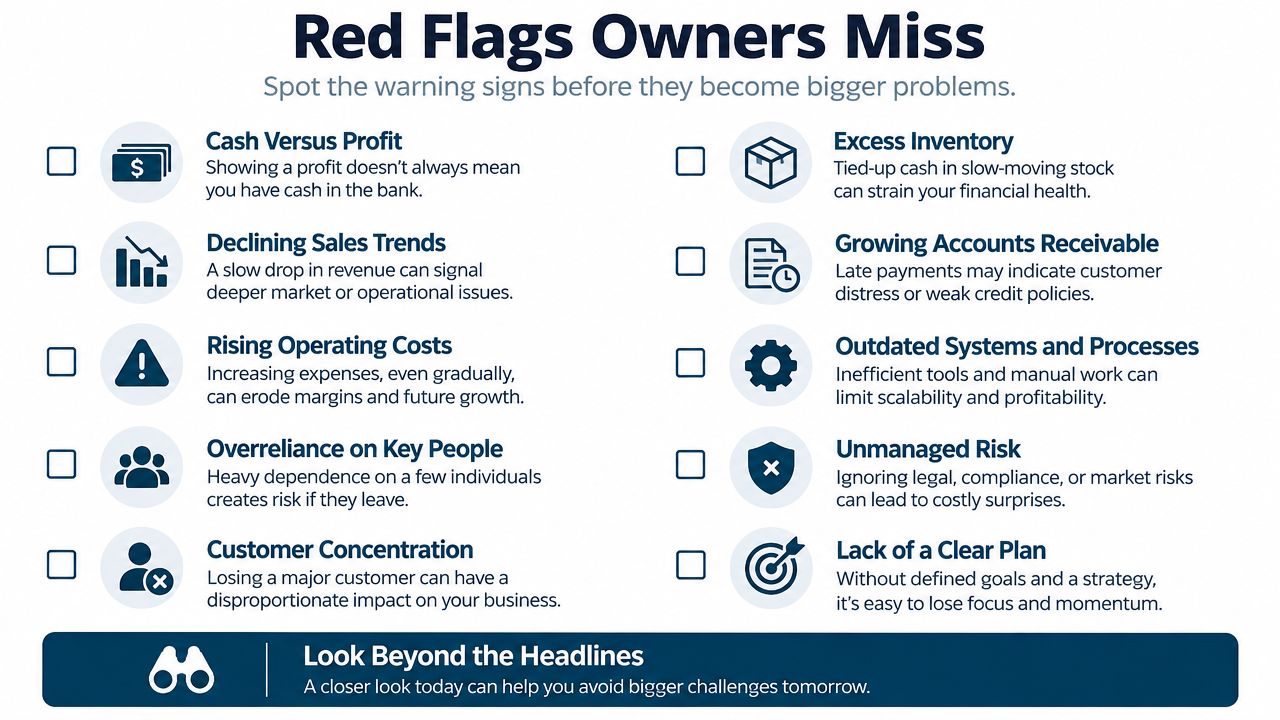
A professional services firm can report strong annual profit after booking several large projects, then struggle to pay payroll because those customers have not paid. The owner signs a lease, hires staff, and faces a tax bill while collections slow. The P&L looks healthy. The bank balance does not.
Profit records revenue when it is earned. Cash reflects when customers pay and the business settles its bills. Those views can move in opposite directions, so review both before approving a hire, committing to new space, or speaking with a bank.
Where the trouble hides
Start with receivables, payables, and capital spending. A profitable month can generate little cash when customers pay late, vendors require quick payment, or the company buys equipment. The cash flow statement reconciles accrual net income to operating cash by adjusting for non-cash items and changes in working capital. Use a practical guide to cash flow analysis to connect the statement to daily decisions.
Then inspect lines that can make profit look stronger or weaker than normal operations:
- Other income: Check whether gains or unusual receipts are being treated as recurring operating revenue.
- Miscellaneous expense: Open the detail. This category can hide personal spending, one-time repairs, or costs assigned to the wrong account.
- Owner compensation: Separate salary, distributions, reimbursements, and personal charges. Combining them with W-2 staff costs distorts normal payroll.
- Accrued revenue: Confirm that recorded revenue was earned during the period and that collection remains realistic.
- Deferred costs: Check whether expenses were delayed or pulled forward, changing the period's result or tax position.
Accounting policies can also change reported margins. Inventory costing, reversals of inventory write-downs, and capitalization of development spending may produce different gross and operating results under IFRS and US GAAP. Review the cross-border income statement comparison guidance before comparing margins across companies. Otherwise, you may cut costs or change prices to correct a classification difference.
Build a 13-week cash forecast that lists expected customer receipts, payroll, taxes, debt payments, vendor bills, and planned purchases by week. Compare it with the P&L. You will see whether the business can fund its commitments, not merely whether it earned a profit.
Use the forecast before signing contracts, adding headcount, or approving large purchases. A profitable company still needs enough cash to survive the timing gap.
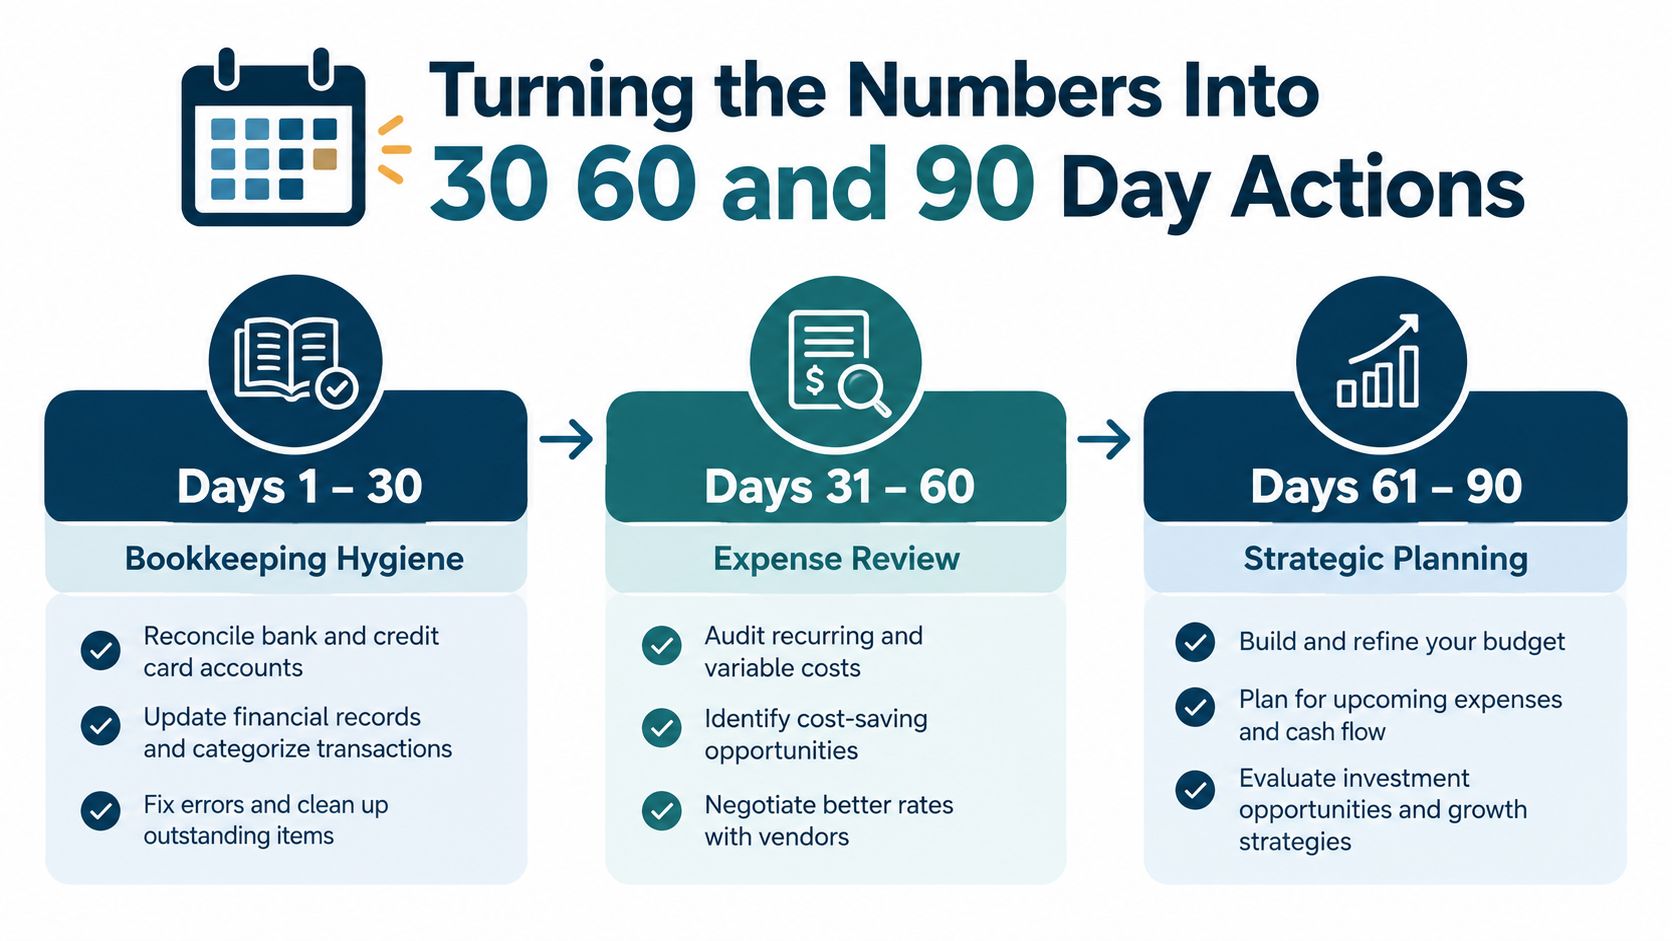
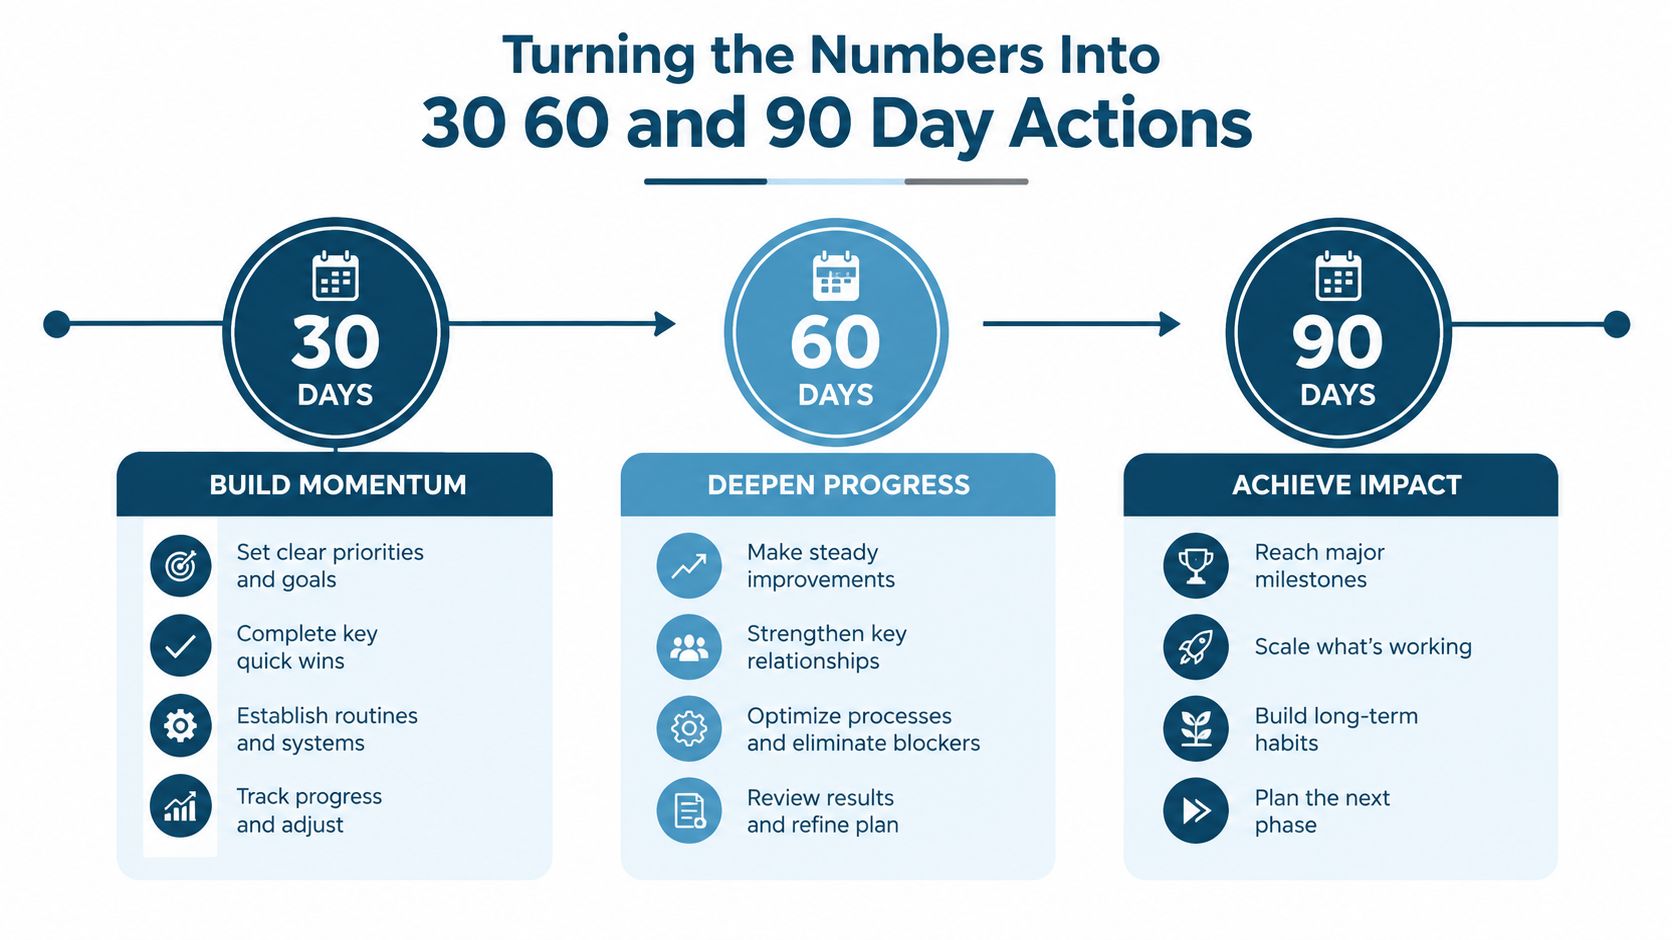
Turning the Numbers Into 30 60 and 90 Day Actions
Analysis without action is expensive entertainment. Assign every finding to an owner decision, an owner, and a deadline.
Days 1 to 30 focus on clean books
Reconcile the prior three months. Clean up cost classifications. Separate owner activity from business activity. Confirm that revenue is recorded in the right period and produce a current P&L alongside a 13-week cash forecast.
Deliverables: Clean account reconciliations, a corrected P&L, a list of unusual transactions, and a cash forecast.
Owner time: A focused review with the bookkeeper, followed by a short decision meeting.
Don't calculate margins from unreliable books. If the underlying records are wrong, precise ratios only create false confidence.
Days 31 to 60 focus on the biggest leak
Calculate gross, operating, and net margins. Run vertical analysis and identify the one or two lines creating the most pressure.
- If COGS is the issue, renegotiate supplier terms or review labor productivity.
- If gross margin is weak, reprice products, services, or contract work.
- If operating expenses have crept up, review headcount, software, rent, and outside services.
- If collections are slow, tighten billing terms and assign responsibility for follow-up.
Deliverables: A margin summary, a cost action list, revised pricing or vendor proposals, and a hiring decision based on capacity rather than hope.
Days 61 to 90 build the management system
Add peer benchmarking, a simple budget, and a monthly reporting pack. Your pack should include the P&L, cash forecast, margin movements, receivables, payables, and a short list of decisions requiring attention.
Bring in fractional CFO support when the reporting workload and decisions exceed what the owner and bookkeeper can handle. A practical trigger is when revenue crosses $1.5 million to $2 million or headcount exceeds 10 to 15 people, but the true test is decision complexity, not a magic threshold.
Deliverables: A board-style report, an updated budget, a hiring and investment plan, and a clear ownership calendar.
MyOfficeOps provides bookkeeping, financial reporting, forecasting, profitability analysis, and CFO-level advisory for small and midsize businesses. Visit MyOfficeOps to turn a messy P&L into a clean reporting system tied to pricing, hiring, cash flow, and growth decisions.