

A reporting dashboard is a single screen of the few numbers you run the business on, so you can see if you're on track without opening five reports. Say it's a Tuesday morning and your lead tech just asked for help. You want to say yes to a hire. You also want payroll to clear next week without a scramble. Those two wants need the same few numbers, side by side, right now.
Why a Stack of Reports Still Leaves You Guessing

Say you run a small shop or firm with twelve people. You've got last month's profit and loss open in one tab. Your bank balance is in another. A spreadsheet of unpaid invoices sits on your desktop, and nobody's sure if it's the newest copy.
The profit and loss says you made money. The bank balance looks thin. Two big invoices are late, but one client swore the check went out Friday. So can you hire, or do you wait?
The numbers exist, but they don't sit together
That's the main problem for many owners. The facts are already in your software, your bank, and your inbox. They're just scattered, so every choice starts as a hunt through files and tabs.
Storage isn't the same as a view you can use. Your books can hold every sale and still leave you guessing on a Tuesday.
Your bookkeeping software stores each bill, payment, and pay run. That's its job. But storage is like a filing cabinet. You still have to pull the right folders, line them up, and work out what they mean together.
Think about your car
You don't read the engine manual while you drive. You glance at your speed, your fuel, and any warning light. Then you speed up, slow down, or pull over.
That's what a reporting dashboard does for money and daily work. It puts cash on hand, money coming in, unpaid invoices, and profit in one place. You glance, you get the story, you act.
Say sales look strong but fuel, meaning cash, is near empty. That one glance tells you to chase payments before you add payroll. No single report on your desk tells that story on its own.
What you'll get from this screen
A good screen doesn't dump every number you own on you. It shows the few that change a real choice, like hiring, pricing, or calling a late payer. The rest of this piece walks through how that screen differs from a monthly packet, what sits on it, who uses which view, and how you know a number is safe to act on.
What a Reporting Dashboard Is Compared with a Report
A regular report tells the story after the month is over. A dashboard is the glance you take while the month is still moving. Start with the side by side view, since that clears up most of the mix up fast.
| Question | Regular report | Reporting dashboard |
|---|---|---|
| When you see it | After the month or quarter closes | On one screen during the month |
| What it shows | Full statements and history | A few KPIs, charts, and exceptions |
| How you use it | Read the packet, then ask follow ups | Filter, drill in, and act the same week |
| What it compares | This period versus the last one, if someone builds it | A target, budget, last month, or last year |
| Main job | Record what already happened | Show whether you are on track now |
Four ways the screen earns its keep
A dashboard pulls summary results, charts, goals, and controls into one place. A review of dashboard features describes dashboards as showing performance against targets, using visuals to explain complex data, letting users filter or drill into detail, and giving real time or near real time feedback instead of waiting for a monthly or quarterly report.
- A result against a target: Cash of forty thousand dollars means little alone. Cash of forty thousand against a fifty thousand dollar floor you set for yourself means act now.
- A picture over rows: One bar that dips for three weeks beats scanning hundreds of lines to spot the same slide.
- A filter you control: You narrow the view to one customer or one job yourself, instead of asking someone to rebuild a file.
- A fresher rhythm: The view updates daily or close to the moment, so you can fix a problem while it's still small.
One contractor, one screen
Say a contractor opens one screen before a client call. She sees total sales, unpaid invoices, profit by job, and the cash balance together. One kitchen job looks off, so she filters to that single project.
Now she can see costs climbing on that job while the client still owes a progress payment. She calls the client about the payment and calls her lead about the costs, both that morning. That's a tool for choices, not a folder for records.
If reading the statements behind the screen is the hard part, our guide on reading your financial reports in plain terms walks through what each line is really telling you. Online sellers face the same split, and a clear take on making sense of Shopify subscription data shows how a live view differs from digging through past exports.
Plain rule: The screen points you to the statement, job, or invoice that needs a human look. It doesn't replace the full statements.
The Parts That Make a Dashboard Useful
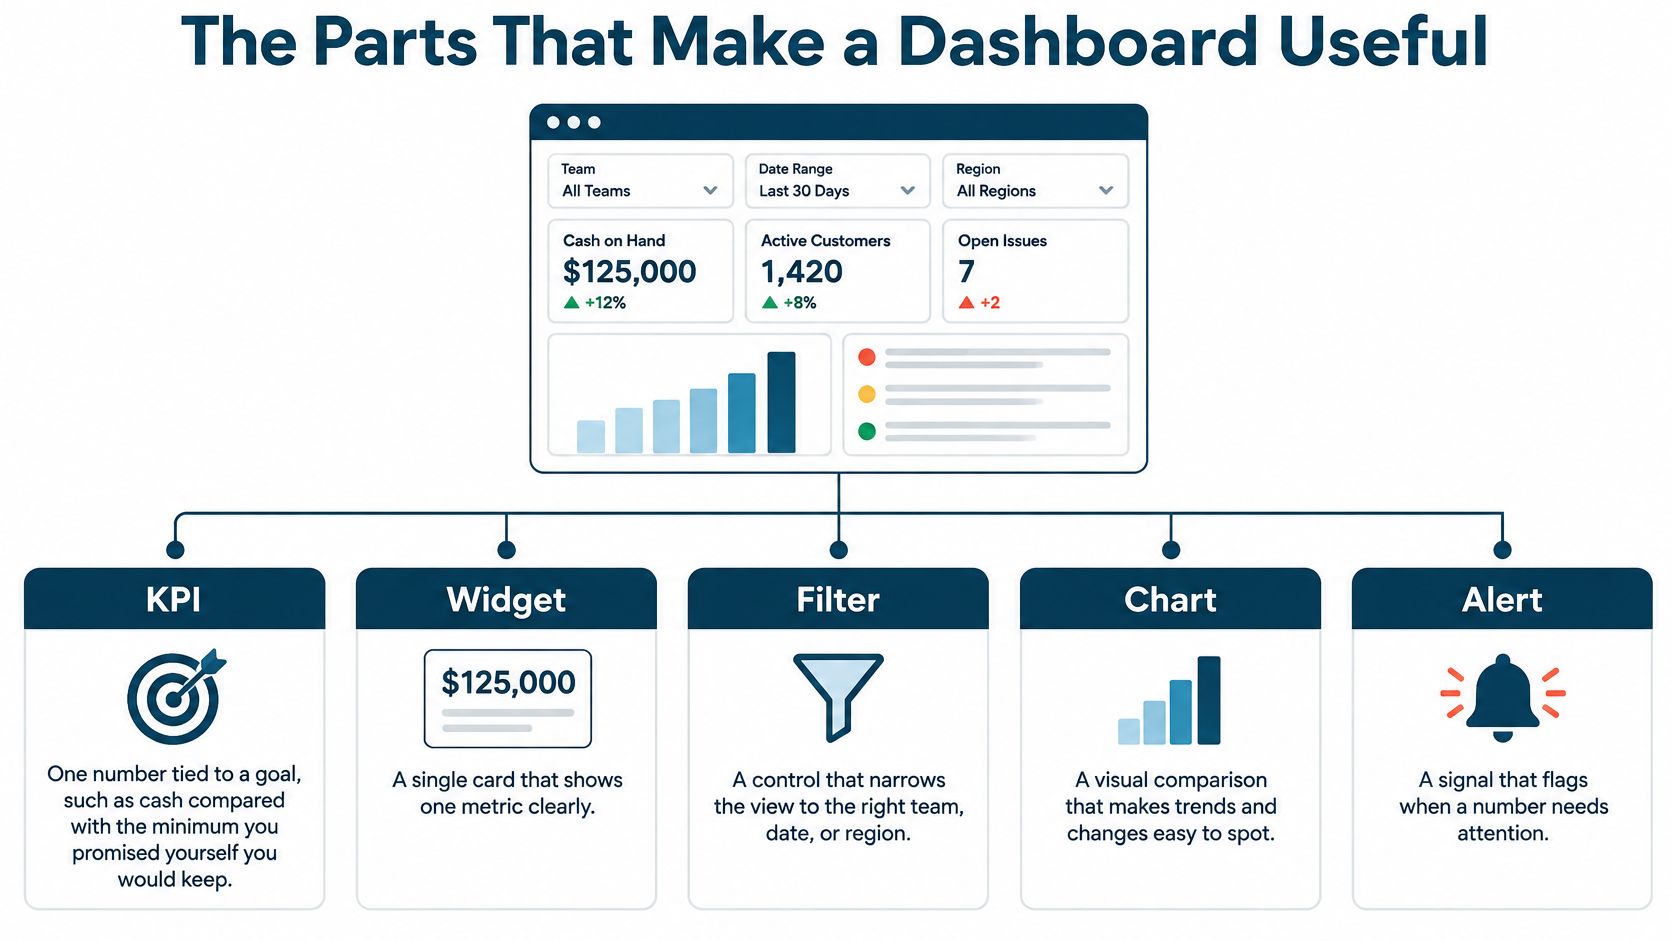
Think of the screen like a kitchen, not a poster. Each part has a job, and if one part is missing, the meal doesn't come together. Here are the five pieces you'll see on most small business screens.
| Part | What it does | Small-business example |
|---|---|---|
| KPI | One number tied to a goal | Cash balance versus a minimum reserve |
| Widget | The card, chart, or table that holds the number | Unpaid invoices grouped by how old they are |
| Data source | The system the number comes from | Books, payroll, customer list, job tracker, or bank |
| Filter | A way to narrow the same view | By month, customer, or project |
| Target | The line you compare against | Budget, last month, last year, or a rolling average |
Write the recipe before you draw the chart
A KPI is one number tied to a goal, like cash compared with the least you promised yourself you'd keep. The Microsoft guide to KPI dashboards describes these screens as unifying data sources and giving at a glance feedback on performance against defined KPIs, with baseline history and a clear monitoring cadence.
Before anyone builds a chart, write down five things for each number. Write the formula, the time period, the source system, the person who owns it, and what you'll compare it with. That one page stops sales and finance from meaning two different things by revenue or margin.
If you're not sure which numbers deserve that treatment, our explainer on picking key performance indicators that fit your business keeps it to the measures owners watch. Shops that make things can also learn from Supply Automate's manufacturing dashboard guide, which ties floor numbers to the same idea of one clear view.
Two chains you can feel in your gut
Chain one starts with payroll hours meeting job revenue from the books. The screen shows whether a busy week made money or whether overtime ate the profit. Busy and broke is a real thing, and this chain exposes it.
Chain two starts with unpaid invoices grouped by age meeting the cash balance. A fat sales month can still leave you short if three clients pay sixty days late. Seeing those two numbers together turns a vague worry into a call list.
End with the move, not another chart
- Job margin under target: Open that job and find where costs ran over.
- Customers paying slower: Call the oldest invoices first, this week.
- Forecast cash under your reserve: Wait on the hire or the big purchase.
Five to seven measures beat a wall of thirty. If a number on the screen wouldn't change what you do, it doesn't belong on the first view.
How Small Businesses Use One Screen
The idea stays the same across trades. The numbers change because the daily worry changes. Here are three shops, three Tuesday questions, and the screens that answer them.
The small agency that sells people's time
Say you run a marketing agency or a consulting firm with eight billable staff. Your big worry isn't sales on paper. It's whether your people are packed too tight, and whether each client leaves profit after labor.
Your screen shows billed hours, how busy each person is, and profit by client. One client eats twice the hours you priced for. Two staff sit near full while a third has open days.
So you move work to the person with room, and you hold off on the new hire. You also start a hard talk about raising that one client's price. Both moves happen this week, not after month end.
The clinic with a full waiting room and an empty bank account
Say you run a physical therapy or dental practice. The schedule is packed, so everyone assumes money is fine. Then payroll Friday feels tight, and nobody can say why.
Your screen shows appointments booked, amounts billed, amounts collected, payroll, and the bank balance. Bookings look great. Collections tell a different story, because one payer's payments sit unpaid for weeks.
A full schedule can still be a cash problem. Your office manager calls that payer with a list of open claims, instead of guessing which ones are stuck. The screen turned a bad feeling into a named problem.
The contractor who trusts the total too much
Say you run a remodeling crew with four jobs going at once. The company total looks healthy, so you bid the next job with confidence. But averages hide losers, and one bad job can eat the profit from two good ones.
Your screen shows contract value, costs so far, profit on each job, and unpaid progress payments. One kitchen remodel is sliding into the red, buried inside a fine looking total. Materials ran over and the second payment is still out.
You walk that job with your lead before it ends, and you bill the progress payment today. Catching it mid job means you can still fix it. Catching it in a year end report means you just get to feel bad about it.
Pick the choice you repeat every month, like hiring, pricing, or chasing payments. Then build only the numbers that could change that choice.
In all three shops, the books are the base. The screen is just a smarter cut of the same numbers, shaped around one recurring decision.
How to Design a Dashboard People Will Open
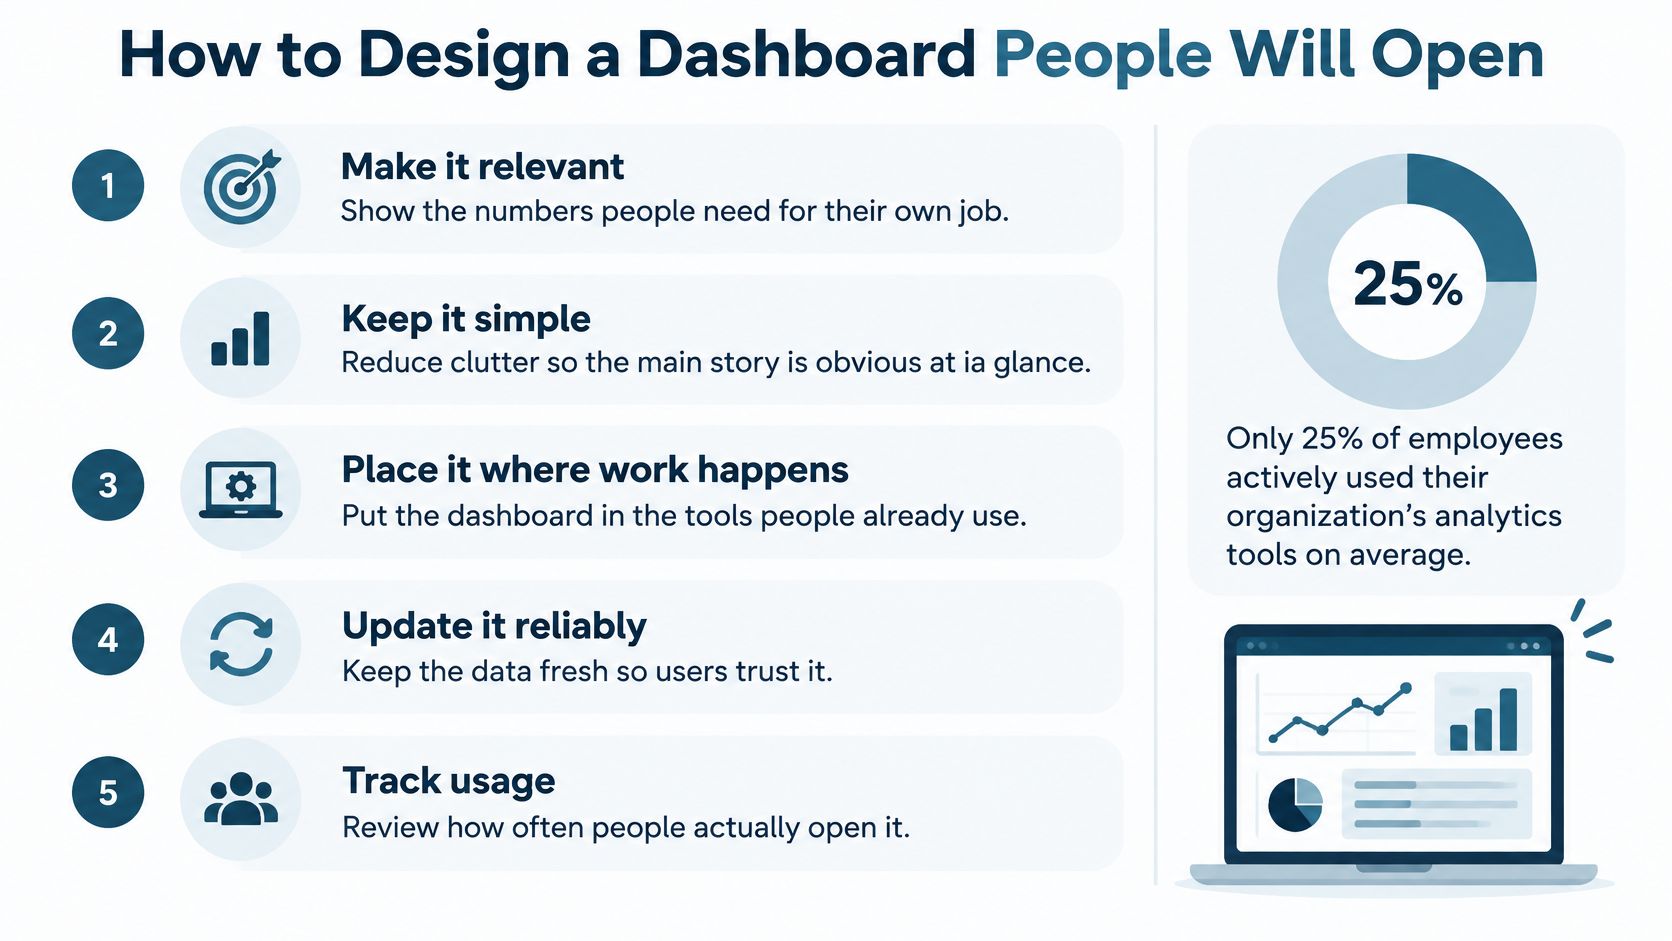
Buying a screen doesn't mean anyone will look at it. The BARC and Eckerson Group adoption survey from November and December 2021 included 214 data and analytics leaders worldwide and found that an average of only 25% of employees actively used their organizations' business intelligence or analytics tools. That share had shown minimal growth over the previous seven years.
Build it with the people who'll stare at it
The lesson for a small company is blunt. A dashboard is a conversation, not a trophy. The owner, the bookkeeper, and a department lead often need different cuts of the same numbers.
A healthcare dashboard co-design study had 20 people, including healthcare staff, managers, and a patient representative, help build the prototype before usability testing. The person who knows the data isn't always the person who does the daily work. If your foreman can't read the screen on a phone between jobs, the chart failed, even if the math is right.
Practical guides on how to build a dashboard for banking decisions make the same point in another trade. Start with the reader and the choice, then pick the charts. Never start with the charts.
Design choices that keep people coming back
- Few numbers, tied to a choice: Keep the first view to measures linked to a decision someone makes every week or month.
- Normal words: Write "cash left after bills" style labels, and put a one line meaning under each number.
- More than color: Don't let red and green carry the whole message, since that fails some readers and dies in a black and white printout.
- Text behind every chart: Add a plain total or small table so the point survives without the picture.
- Works anywhere: Labels should be readable by a screen reader, and filters should work with a keyboard or a touch screen.
Run the three question test
Hand the screen to the person it's built for and watch. Can they find cash fast? Can they say what a warning means? Can they open the detail behind a total?
If the answer to any of those is no, take a chart away before you add one.
How to Tell a Number Is Safe to Act On
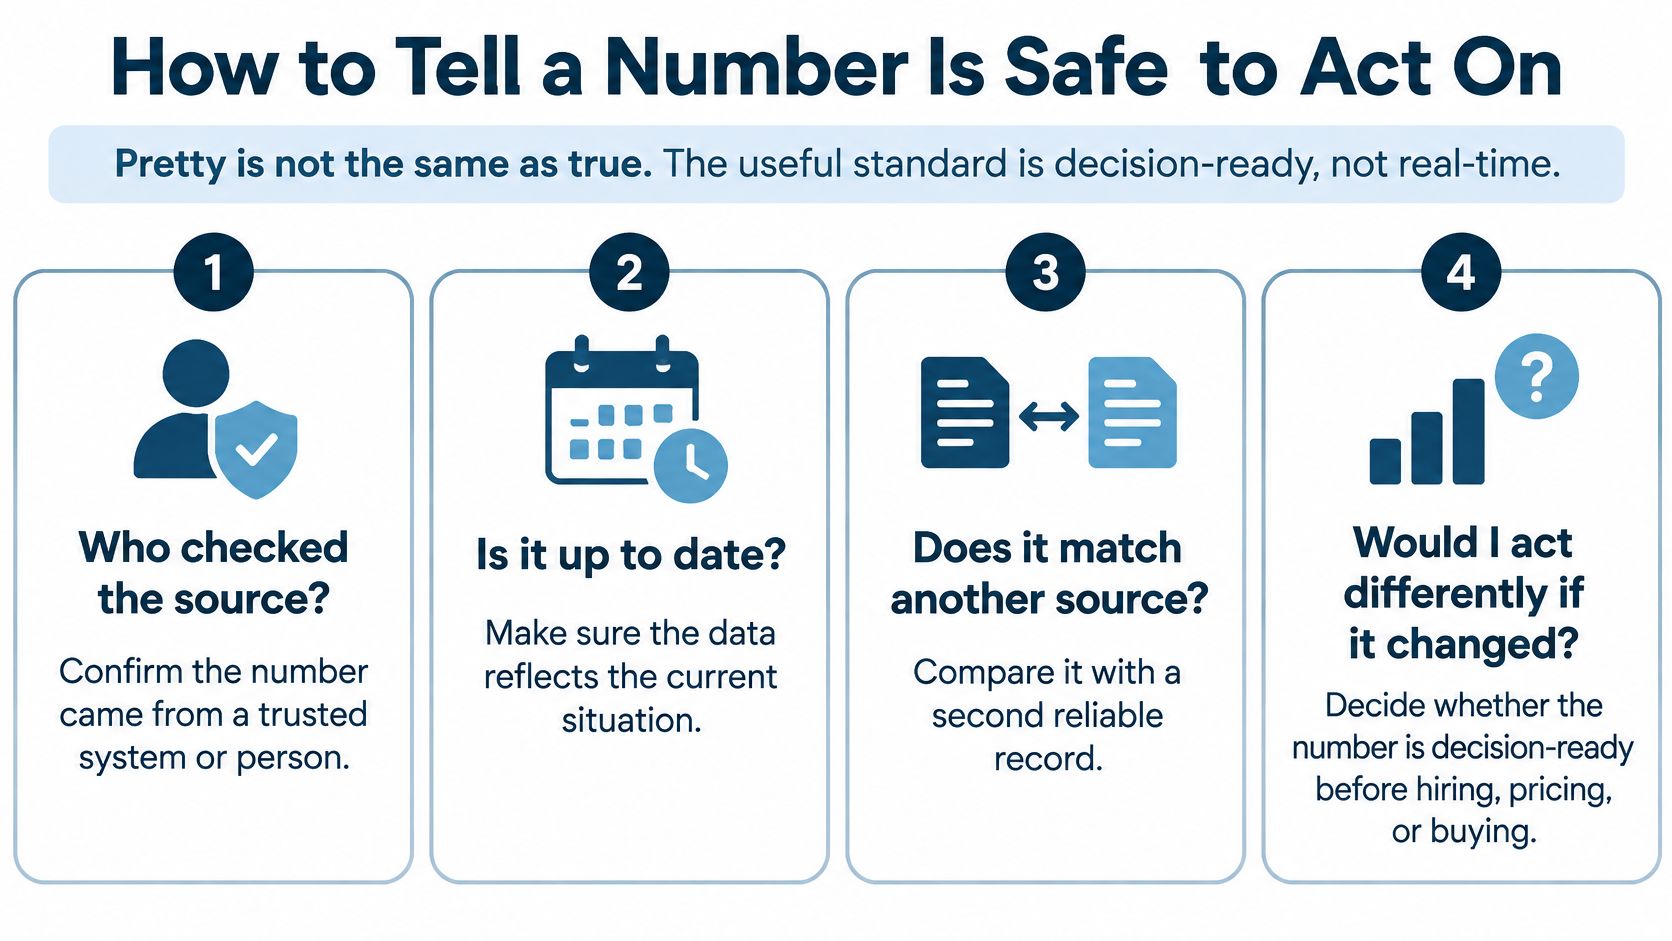
Pretty isn't the same as true. A clean chart can sit on top of messy books and still look certain. The standard you want is decision ready, not real time.
Four questions before a number changes your plans
- Who checked the source: A named person looked at where this figure came from.
- Fact or estimate: The screen says plainly if this is a recorded result or a guess about the future.
- When it last refreshed: A stale refresh can look exact while cash, payroll, or job costs already moved.
- What's missing: A transaction in the wrong bucket, or one that never got entered, can flip the story.
Keep what the books recorded apart from forecasts, accruals, and what if cases. Label them so nobody treats a guess as a fact. A tight month end close routine is what turns raw entries into numbers you can lean on.
AI makes this sharper, not softer
A 2025 Thryv survey of small business AI use found that 62% of small business AI users applied it to data analysis, while 63% used AI daily. Yet broader small business research in that same release found only 23% reported high trust in AI outputs, 55% were developing a formal review process, and just 25% already had one.
That gap makes sense. A tool can sum up a messy ledger faster and still be wrong, just wrong with confidence. In agencies, clinics, and construction, cash, accrual profit, payroll, and job profit can tell different stories on the same day.
So keep the human path simple. Reconcile the inputs, show the formula, show the assumption, and name who reviews odd results. Speed without that path just spreads a bad figure to more people, faster.
Start with Clean Books and One Clear Screen
You don't need a big software project to start. You need one decision, four or five honest numbers, and a set day to look at them. Here's a first month that fits on an index card.
- Pick one stuck decision: Choose the call you keep putting off, like a hire, a price change, or how much cash to hold back.
- Write the numbers that would change your mind: For most owners that's revenue, gross profit, unpaid invoices, and cash, plus one trade number like job profit or how busy your staff is.
- Check the source: Each number should come from reconciled books, not a side spreadsheet with last quarter's labels. If the categories are messy, clean the books before you buy another chart.
- Put it on one screen and set the rhythm: Label actual results apart from forecasts, then review it on the same day each month with the person who keeps your books.
That's the order we use at MyOfficeOps too. We get a client's books in order first, then build clear reports that show where the business stands, then help with the big calls. Our financial reporting work covers custom reports, KPI tracking, and financial analysis, explained in plain English so each number points to a next step.
Last, write down what you'll do if each number moves the wrong way. That one line turns a pretty screen into a habit you'll keep.
If your reports still leave you guessing about a hire, a price, or next month's cash, we can clean up the books behind the numbers and build one clear screen around the decisions you make every month. You'll get custom reports and KPI tracking explained in plain English, plus a person who reviews the odd results with you before you act. Visit MyOfficeOps to start with a conversation about what your first screen should show.