
You're probably not thinking about solvency on a normal Tuesday.
You're thinking about payroll on Friday, a truck that needs repairs, a client who pays late, or whether now is the right time to buy equipment, hire one more person, or open a second location. Then a banker, investor, or advisor asks for financials, and one of the quiet questions behind that request is simple: Can this business carry its debt and stay standing if things get tight?
That's what solvency gets at. It's less about today's checking account balance and more about long-term staying power. For a contractor, that might mean handling equipment loans through a slow season. For a medical practice, it might mean covering obligations while insurance reimbursements lag. For a law firm or IT shop, it might mean making sure partner draws and fixed costs aren't hiding a weak balance sheet.
Why Solvency Matters for Your Business
A lot of owners hear “solvency ratio” and assume there's one magic formula. There isn't. Solvency is really a family of ratios, and that's where many people get tripped up.
One ratio looks at debt compared with assets. Another compares debt with equity. Another asks whether earnings can cover interest. A practical overview from Financial statement analysis basics helps frame why no single number tells the whole story.
What a lender is really asking
Say you own a small HVAC company and want financing for two new vans. The lender isn't only asking whether revenue looked good last year. They want to know whether your business has enough financial strength to carry more debt without becoming fragile.
That's the practical use of solvency. It answers questions like:
- Can you borrow safely: Will new debt support growth, or pile on pressure?
- Can you absorb a rough patch: If a few jobs get delayed, will the business still meet its obligations?
- Can you plan beyond this quarter: Are you building something durable, or just surviving month to month?
Practical rule: Solvency matters most when you make long-term decisions with long-term consequences.
Why context matters more than a single target
One of the most useful points business owners miss is that a “good” solvency ratio isn't universal. A source discussing common solvency measures notes that businesses often look at debt-to-equity, debt-to-assets, and interest coverage, and that something above 20% may be considered good, but it also stresses that this varies by industry, so context matters more than a blanket rule (YouTube discussion on solvency ratio context).
That tracks with what happens in real businesses. A construction company may carry more debt because equipment is expensive. A consulting firm may have low debt but still struggle if owner pay is too high and collections are slow.
So if you're looking for a clean answer, here it is: solvency matters because it shows whether your business can keep its promises over time. That affects loans, vendor confidence, ownership decisions, and your ability to sleep at night.
The Main Solvency Ratios You Should Know
You don't need a wall of formulas. Most small business owners can get a lot of value from three core views.
Modern finance training treats solvency as a broader framework, with six commonly used solvency ratios: debt-to-assets, debt-to-capital, debt-to-equity, gearing ratio, interest coverage, and long-term debt-to-equity (Financial Edge on solvency ratios). For day-to-day SMB use, I'd focus on the ones that answer the fastest practical questions.
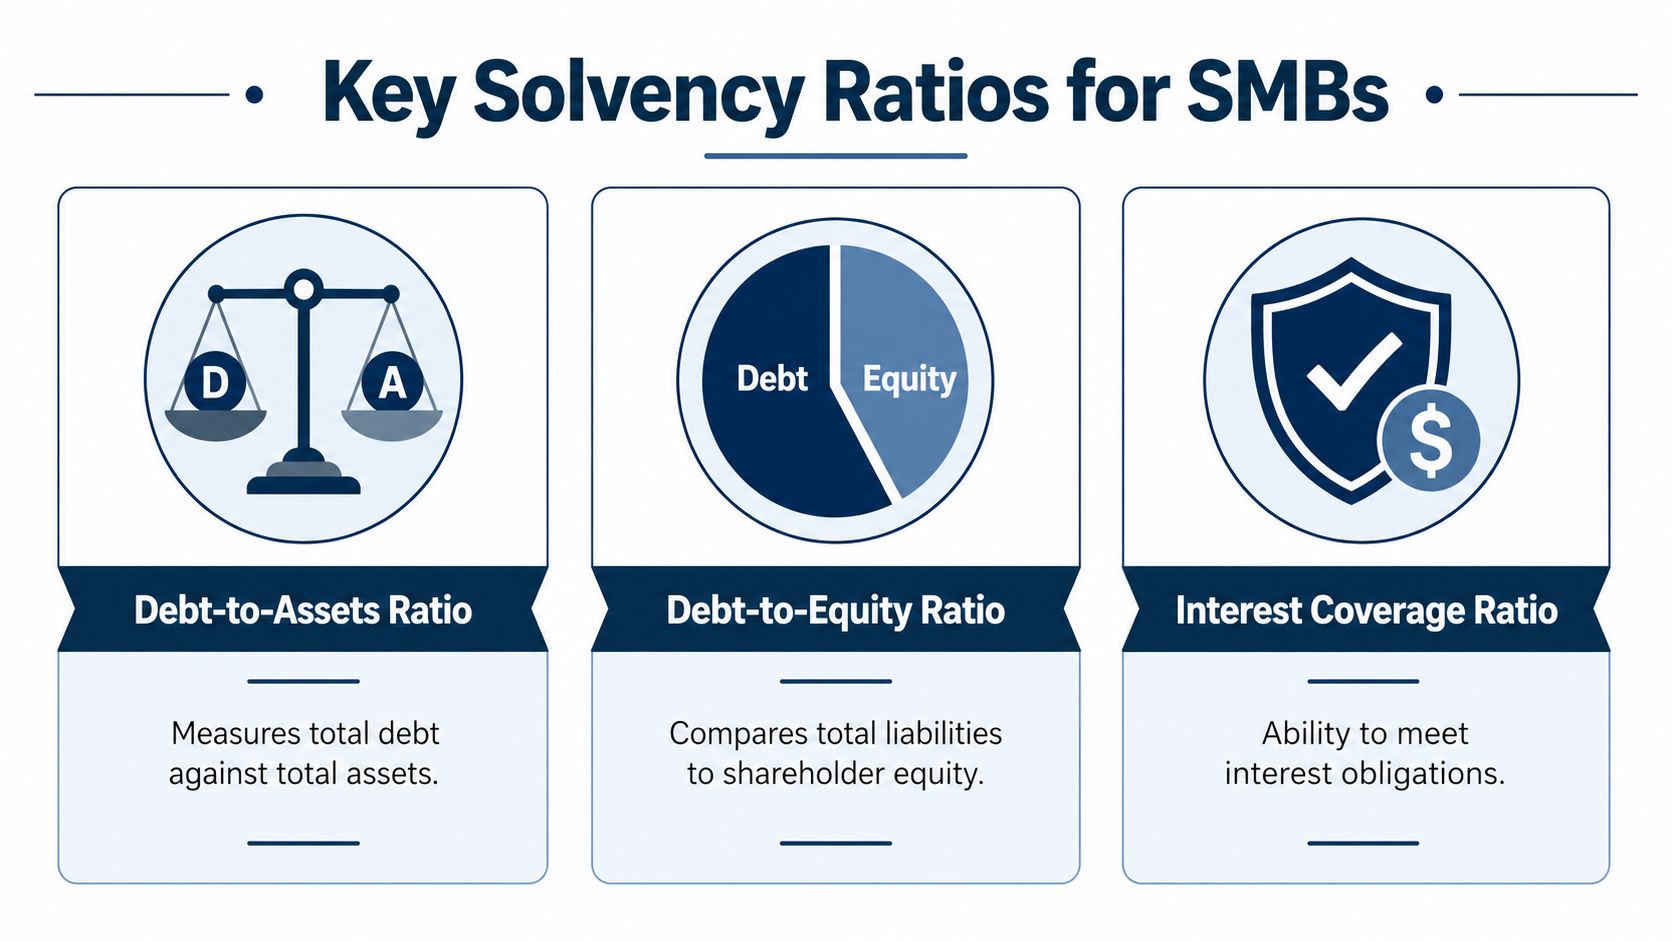
Debt-to-assets ratio
This one asks: How much of what your business owns is financed by debt?
If your company has trucks, tools, equipment, receivables, and cash, this ratio compares your total debt to those assets. It's useful when you want a broad balance-sheet view.
For a trades business, it's a bit like looking at a house and asking how much of it the bank really owns through the mortgage.
Debt-to-equity ratio
This asks: How much do you owe compared with what the owners have built in the business?
It's one of the clearest ratios for talking with lenders and investors because it shows how heavily the company leans on borrowed money versus owner capital and retained earnings.
A high number doesn't always mean trouble. But it does mean your business has less cushion if profits drop.
Interest coverage ratio
This ratio asks: Can your operating earnings cover your interest expense?
Financial Edge notes that interest coverage ratio = EBIT divided by interest expense in common solvency analysis; a company can look okay on debt balances while still getting squeezed by borrowing costs.
That's why I like this ratio for businesses with lines of credit, term loans, or variable-rate debt. It spots stress earlier than some balance-sheet ratios do.
A stable debt load can still become a problem if the cost of carrying that debt rises.
Which ratio to use when
| Ratio Name | What It Measures | Best Used For |
|---|---|---|
| Debt-to-Assets | Debt compared with total assets | A quick balance-sheet health check |
| Debt-to-Equity | Liabilities compared with owner equity | Loan discussions, investor review, capital structure decisions |
| Interest Coverage | Operating earnings compared with interest expense | Monitoring debt burden and rate pressure |
The simple takeaway
If you only use one ratio, you'll miss something.
- Use debt-to-assets when you want the broad picture.
- Use debt-to-equity when ownership cushion matters.
- Use interest coverage when debt payments are starting to pinch.
A contractor, dental practice, and marketing agency can all have the same revenue and very different solvency stories. The ratio you choose should match the decision you're trying to make.
How to Perform a Solvency Ratio Calculation
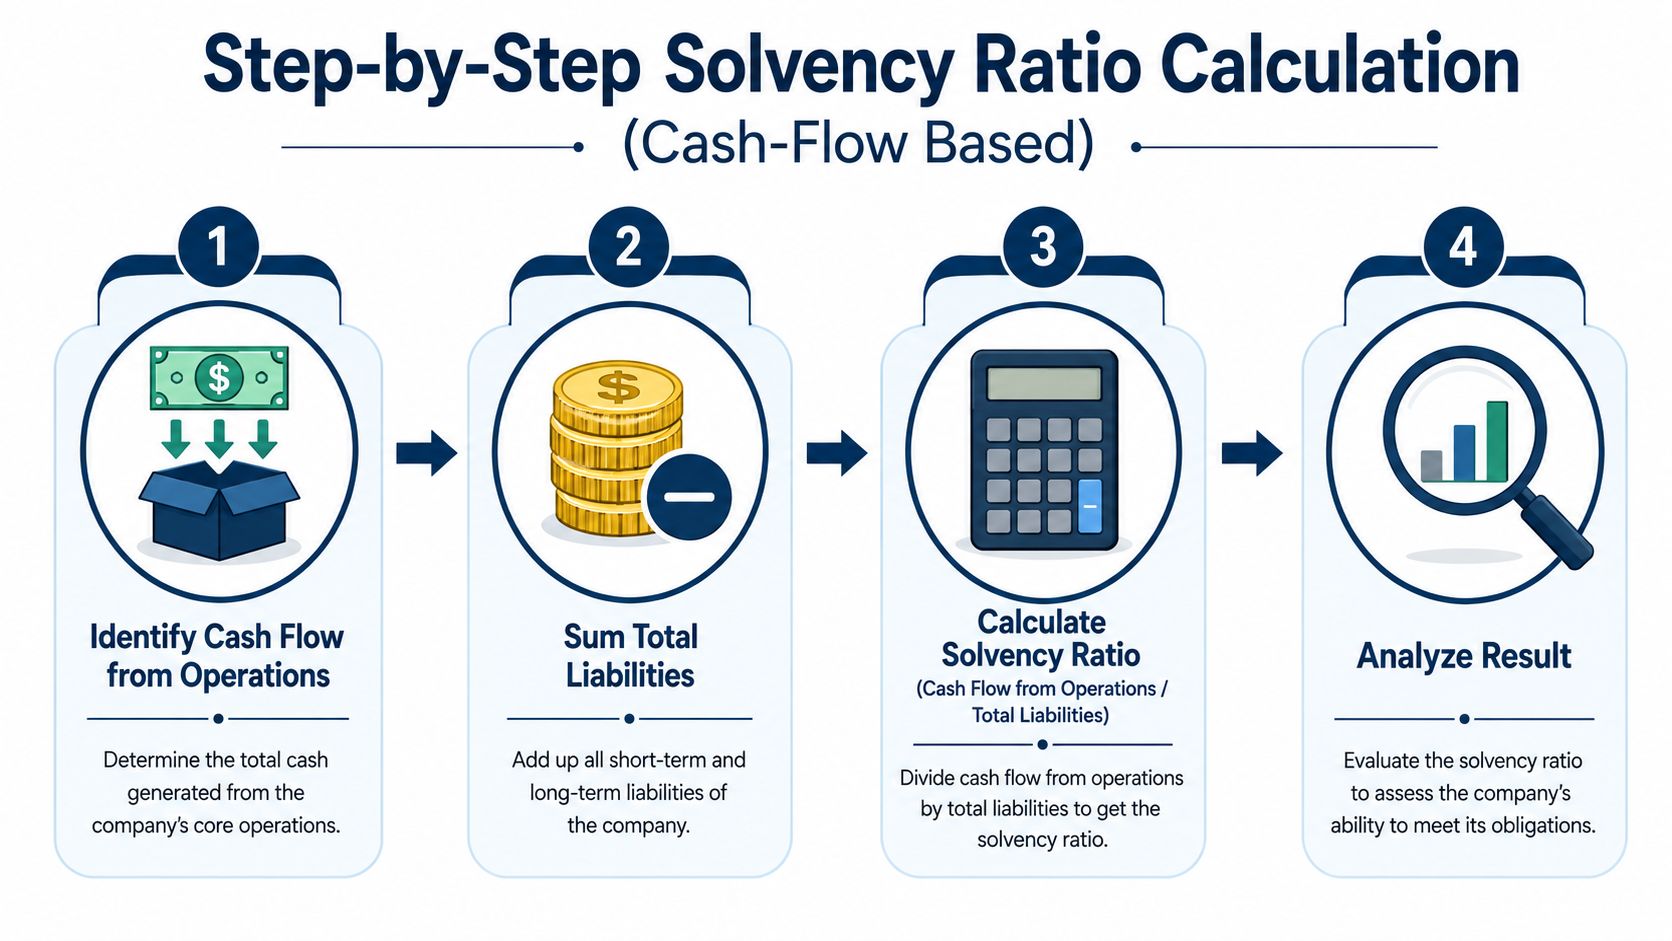
For most SMB owners, the most useful version is the cash-flow-based solvency ratio. It gets to the point fast: is the business generating enough from operations to support its liabilities?
The standard formula is:
(Net Income + Depreciation + Amortization) ÷ Total Liabilities
A practical guide to reading a balance sheet helps if you need help pulling the right lines from your statements.
Pull the right numbers first
You'll need items from two reports.
From your income statement:
- Net income
- Depreciation
- Amortization
From your balance sheet:
- Short-term liabilities
- Long-term liabilities
Add short-term and long-term liabilities together to get total liabilities.
A simple example
Let's use a fictional Philadelphia-area construction company. We'll call it Keystone Build Co.
At year-end, the books show:
- Net income
- Depreciation
- Amortization
- Short-term liabilities
- Long-term liabilities
I'm not plugging in sample dollar figures here because the primary benefit is the setup. Once you pull those numbers from your own statements, the math is straightforward:
- Add net income + depreciation + amortization
- Add short-term liabilities + long-term liabilities
- Divide the first total by the second
That gives you the ratio.
What the result tells you
Verified benchmark guidance says a standard solvency ratio calculation is (Net Income + Depreciation + Amortization) ÷ Total Liabilities, and that a ratio below 25% often signals long-term distress, while healthy firms typically stay above 30%. It also notes that capital-intensive sectors like construction may naturally fall around 20% to 25%, while service firms may run around 35% to 40%.
That's useful, but don't use it like a pass-fail test. A contractor with financed equipment will usually look different from a therapy practice or design firm.
Bookkeeping shortcut: If your books lump liabilities together sloppily, the ratio won't help much. Clean classification matters.
Common mistakes that throw this off
Most bad solvency ratio calculations come from bad inputs, not bad math.
- Using messy financials: If loans, credit cards, and current portions of debt aren't posted correctly, the denominator is wrong.
- Ignoring non-cash add-backs: Depreciation and amortization matter here because the formula is trying to get closer to operating cash generation.
- Mixing tax returns with internal books: Those reports serve different purposes. Use a clean set of financial statements.
- Treating one month like a trend: A single month can be noisy, especially in construction, healthcare, or project-based work.
What works in practice
For most owners, the best rhythm is quarterly. Annual review is too slow if debt is growing. Monthly can be overkill unless you're under lender pressure or watching cash closely.
If your ratio slips, don't stop at the number. Check:
- whether profit dropped,
- whether liabilities jumped,
- or whether both moved the wrong way at the same time.
That's where the true answer usually sits.
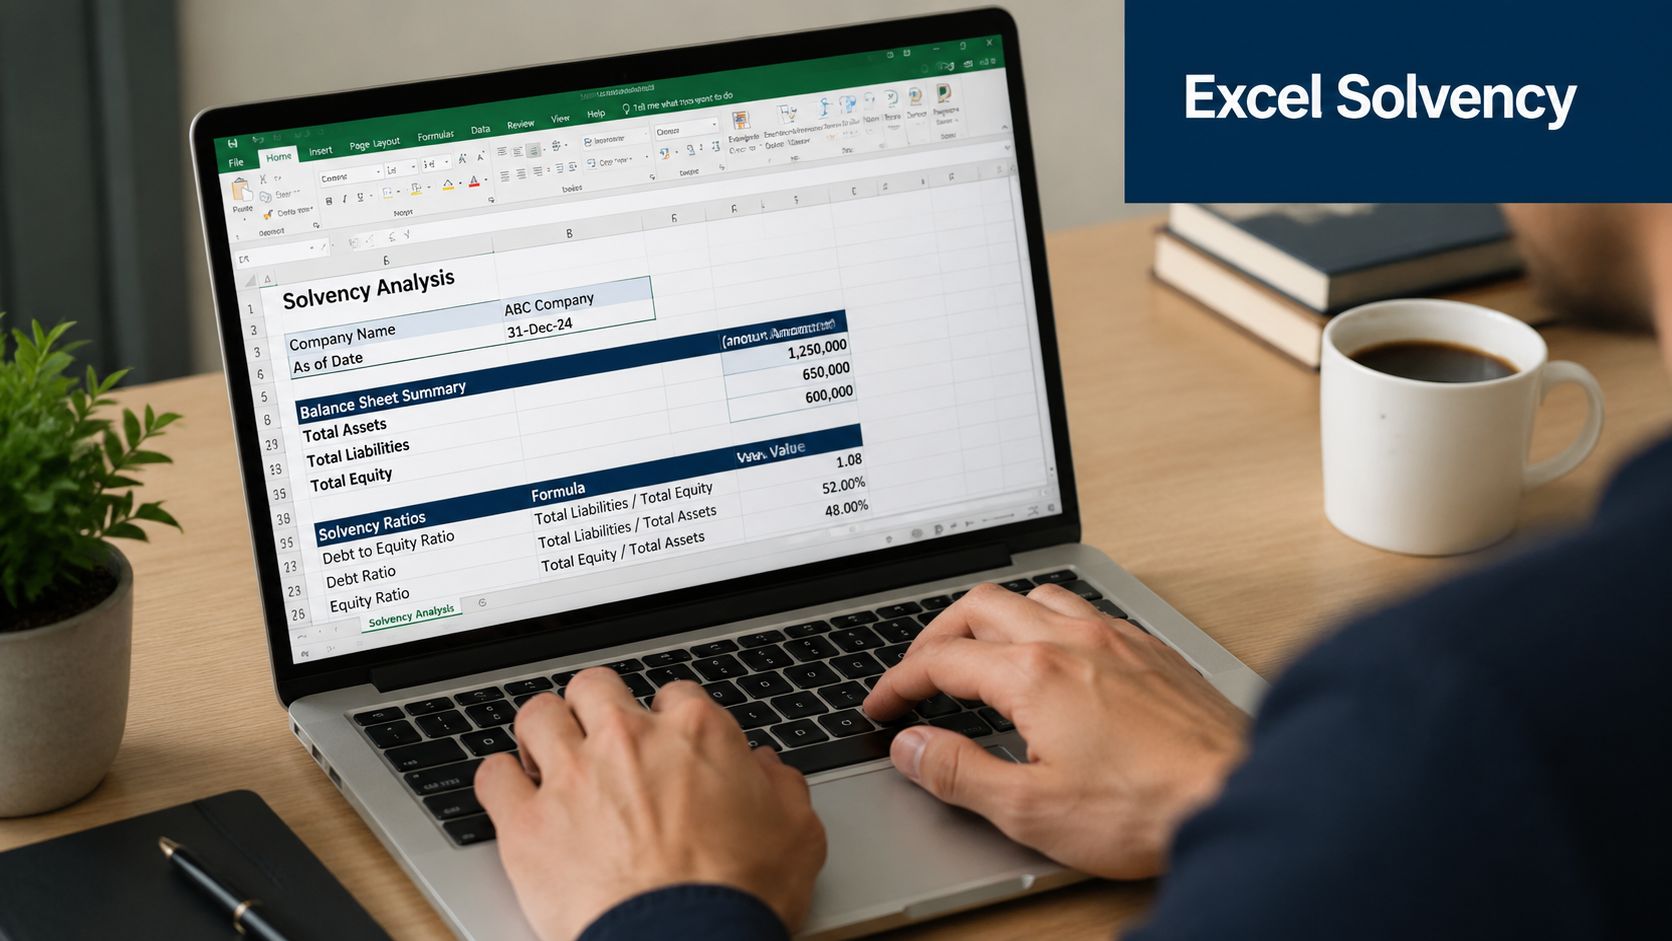
A Simple Excel Template for Tracking Solvency
You don't need a fancy dashboard to track this. A plain Excel file or Google Sheet works fine if it's set up well.
Keep the layout boring
Boring is good in bookkeeping. A clean sheet is easier to update and harder to break.
Set up one input section with these rows:
- Net Income
- Depreciation
- Amortization
- Short-Term Liabilities
- Long-Term Liabilities
Then create three calculation rows:
- Cash Flow Proxy = Net Income + Depreciation + Amortization
- Total Liabilities = Short-Term Liabilities + Long-Term Liabilities
- Solvency Ratio = Cash Flow Proxy / Total Liabilities
Track by period, not just once
Put each quarter in its own column. If your business is seasonal, that matters a lot. A roofer may look very different in one quarter versus another. A clinic may carry payroll steadily but see reimbursement timing change month to month.
Add one notes row at the bottom. Write plain-English reasons for any shift, like:
- equipment purchase financed this quarter
- collections slowed
- owner distribution increased
- old loan refinanced
The notes line is where a spreadsheet becomes a management tool instead of a math exercise.
A few spreadsheet habits that help
- Lock formula cells: That prevents accidental edits.
- Label the source report: Note whether each line came from the income statement or balance sheet.
- Compare side by side: Current quarter, prior quarter, and same quarter last year is usually enough for a useful read.
If you do that consistently, solvency ratio calculation becomes routine. You're no longer scrambling when the bank asks for numbers.
What Your Solvency Ratio Result Actually Means
A solvency ratio by itself doesn't make a decision for you. It gives you a signal. Your job is to read that signal in context.
Read the trend before the snapshot
One of the biggest shifts in practical solvency analysis is the move away from one-time interpretation. A recent write-up on trend-based solvency analysis makes the point clearly: tracking trends matters more than staring at a single static number. It also notes that when rates rise, interest coverage can weaken even if debt-to-equity stays stable, which means solvency can deteriorate before traditional debt ratios clearly show it.
That happens all the time in small business. The loan balance doesn't look much different, but interest expense rises, payments tighten cash flow, and flexibility disappears.
Two companies can post the same ratio and mean different things
Take two businesses:
- A construction company with financed equipment, work-in-progress swings, and uneven billing cycles
- A professional services firm with light assets, steady payroll, and fewer hard debt obligations
The same solvency result won't mean the same thing for both. In construction, debt may be tied to productive assets that earn revenue. In a service firm, a weak ratio may point more directly to thin margins, over-distribution to owners, or poor collections.
That's why I always tell owners to pair the ratio with a few basic questions:
| Question | Why it matters |
|---|---|
| Is the ratio improving or slipping? | Trend tells you direction |
| Did debt increase for growth or to cover shortfalls? | The reason behind debt matters |
| Is interest expense eating more of operating earnings? | Debt cost can change before debt balances do |
| Are books clean enough to trust the answer? | Bad data leads to false comfort |
A decent ratio with falling interest coverage is a warning sign, not a victory lap.
Don't ignore the legal and owner-risk side
If solvency weakens and tax debts or unpaid obligations start piling up, owner risk can expand beyond normal business stress. In Australia, for example, LemonAide helps directors with DPNs by explaining how Director Penalty Notices work when company tax obligations aren't handled properly. Different countries have different rules, but the lesson is universal: solvency problems don't stay trapped inside a spreadsheet.
What to do with the result
If your ratio is solid and stable, keep tracking it.
If it's drifting down, act before you feel pain in cash. That usually means reviewing debt structure, owner draws, pricing, collections, and whether profit reaches the balance sheet.
The worst move is waiting until the bank asks questions you should've asked six months earlier.
Improving Your Solvency and When to Ask for Help
Improving solvency usually comes down to two levers. Increase the business's financial cushion, or reduce the pressure from debt.
A common equity-based solvency measure is (Equity / Total Debt) × 100, and a higher percentage indicates a stronger long-term position. In regulated industries, solvency can even become a hard rule. For example, India's IRDAI framework uses a minimum 1.5 or 150% solvency ratio for insurers, which shows how seriously some sectors treat long-term financial stability (ICICI Prudential on solvency ratio requirements).
What usually helps
- Pay down expensive debt first: High-interest balances squeeze flexibility fast.
- Improve profit quality: Better pricing, cleaner job costing, and tighter expense control help more than cosmetic cuts.
- Restructure liabilities: Sometimes the issue isn't total debt. It's timing.
- Protect working capital: A guide on how to improve working capital is useful here because weak working capital often shows up before deeper solvency stress.
If your books are behind, debt is growing, or you're making decisions based on gut feel, get help. Your CPA, outsourced controller, fractional CFO, or a firm like MyOfficeOps can handle the reporting, ratio tracking, and advisory side so you can focus on running the business.
If you want a clearer read on your numbers, MyOfficeOps helps small and midsize businesses organize financials, track key ratios, and turn messy reports into practical decisions. If you're not sure whether your debt load is healthy, that's a good place to start.