
Tuesday night. You open QuickBooks to answer one simple question: Can I afford to hire someone next month? Instead, you find several reports, different date ranges, uncleared transactions, and a profit number that doesn't match the cash in the bank. You still have to decide whether to raise prices, delay spending, or keep pushing through.
That's the point where a financial reporting dashboard earns its place. It isn't a prettier profit and loss statement. It's a decision tool that shows what changed, why it changed, whether the number is trustworthy, and who owns the fix.
A useful dashboard should help you define the right metrics, connect them to your industry, display them without confusion, and build a review habit your team can keep. It should also give you a practical path from messy source data to a reliable first version.
The Moment Every Owner Knows They Need a Dashboard
Most owners don't ask for a dashboard because they want more charts. They ask because the business has outgrown memory, instinct, and a monthly spreadsheet.
A West Chester agency owner might know sales are strong but still wonder why the bank balance feels tight. A contractor might see profitable jobs in the accounting system while unpaid change orders sit outside it. A medical practice might collect plenty of revenue yet wait too long for payer payments. In each case, the problem isn't a lack of data. It's that the important signals are scattered.
The owner needs answers to practical questions:
- Can I hire now?
- Which clients or jobs make money?
- Are late invoices putting payroll at risk?
- Did margin fall because of pricing, labor, or coding?
- Which number can I defend to a banker?
A dashboard brings those answers into one working view. It combines accounting results with operating drivers, then adds the context that a raw report leaves out. Each important tile should show its period, source, refresh date, reconciliation status, and owner.
The standard: If you can't explain where a number came from, don't use it to make a major decision.
This guide focuses on five practical questions. First, what a financial reporting dashboard is and isn't. Second, which core KPIs belong on it. Third, how those KPIs change for professional services, healthcare, construction, and real estate. Fourth, which design rules make the numbers easier to trust. Finally, how to build a useful version over 30, 60, and 90 days without turning the project into another abandoned spreadsheet.
The fix starts with a smaller dashboard, not a larger one. Track the measures that change decisions, connect each to a clean source, and give someone responsibility for correcting exceptions.
What a Financial Reporting Dashboard Actually Is
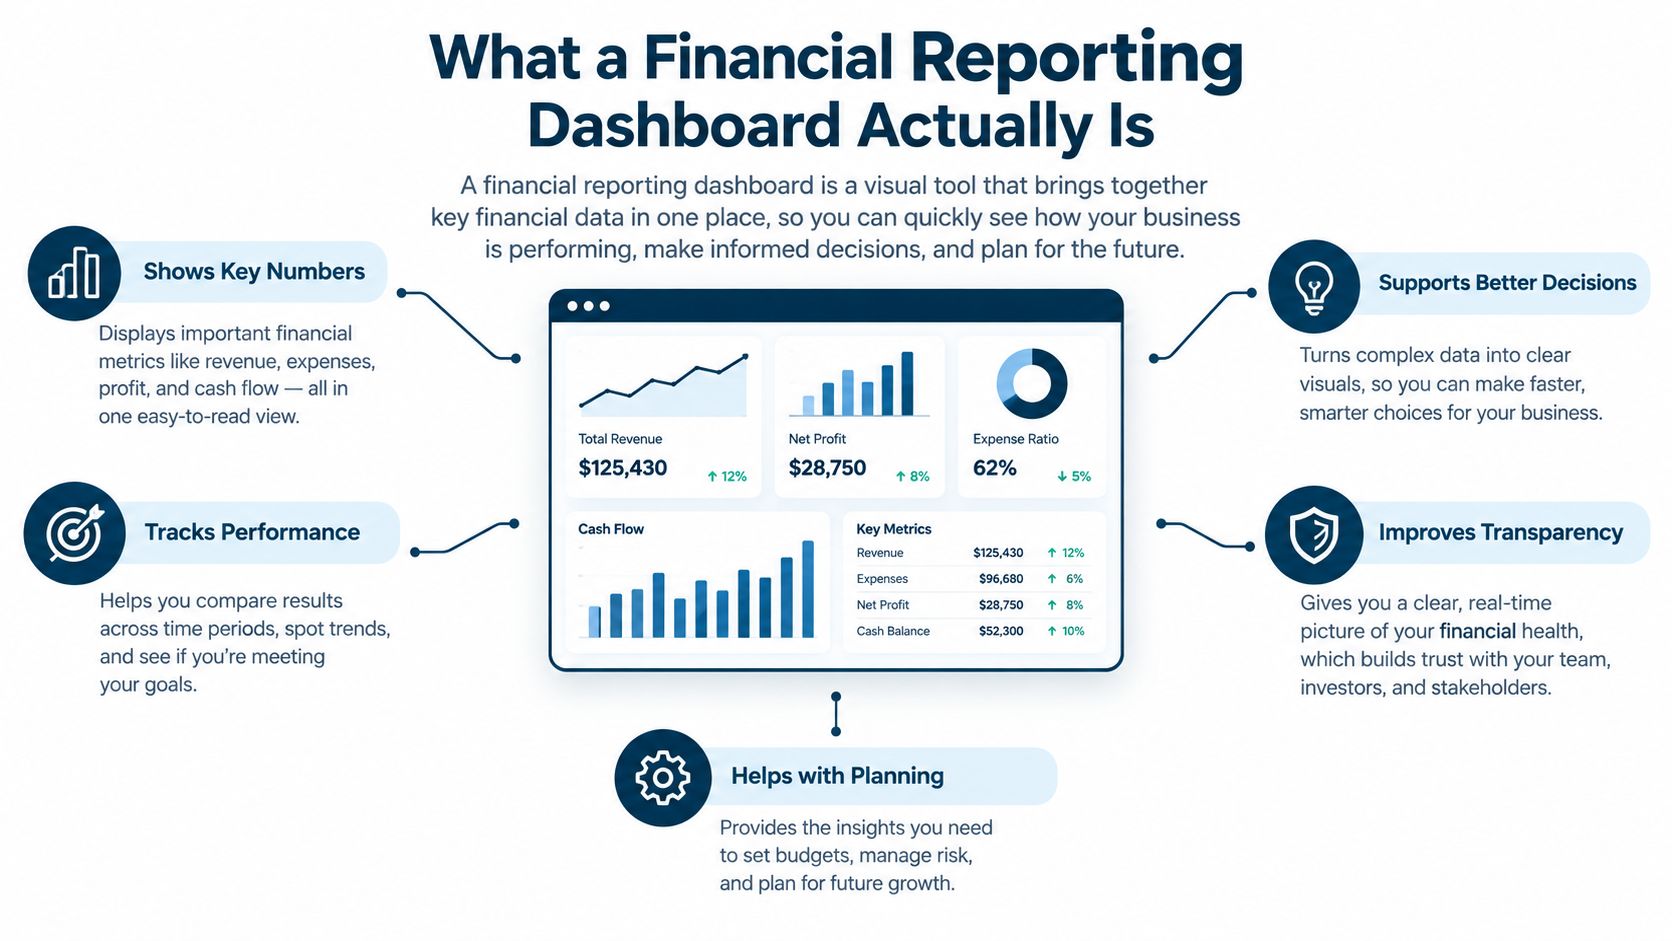
A car dashboard doesn't show every trip you've taken. It shows your current speed, fuel level, warning lights, and useful trends. A financial reporting dashboard works the same way. It gives you a current reading, a comparison, and a signal that tells you where to look next.
A profit and loss statement answers what happened during a defined period. A dashboard answers what needs attention now and what may happen if you do nothing. The P&L remains the formal financial report. The dashboard organizes selected information for recurring decisions.
The three layers are easy to confuse:
- Chart of accounts: The structure behind the data, such as revenue, payroll, rent, and subcontractor expense.
- Financial statements: Formal reports built from those accounts, including the income statement, balance sheet, and cash flow statement.
- Dashboard: A decision view that pulls selected results and operating measures into one place, with trends, comparisons, and drill-down detail.
The KPI dashboard guide is useful for understanding why a KPI needs a defined purpose, not just a prominent position on a screen.
What the dashboard adds
A good dashboard pairs a result with its cause. For example, it might show that gross margin fell, then let you inspect labor cost, pricing, project mix, or unbilled work. It might show cash falling, then point to overdue receivables and upcoming payables.
It also makes definitions visible. The SEC's Financial Statement Data Sets show why standardized, machine-readable data matters for comparing financial concepts across companies and periods. Your business may use internal accounting data instead, but the rule is the same: consistent definitions and repeatable refreshes come before attractive visuals.
Skip the monthly PDF that arrives after decisions have already been made. Build a working view that answers one question per chart and lets you trace a KPI back to the transaction or reconciliation that supports it.
The 7 KPIs Every SMB Dashboard Should Show
A small business doesn't need every metric available in its accounting system. It needs a short list that exposes cash pressure, margin pressure, collection problems, and customer risk.
BLS data shows only 34.7% of private-sector business establishments born in March 2013 were still operating in March 2023, making monthly KPI tracking a survival tool, not a nice-to-have. The Bureau of Labor Statistics data doesn't predict your outcome, but it supports a blunt operating rule: review warning signs before year-end.
| KPI | What it tells you | Roughly good range |
|---|---|---|
| Cash on hand | What the business can use now | Enough for known near-term obligations |
| Runway in months | How long current cash may support spending | Stable or improving |
| Gross margin | What remains after direct delivery costs | Consistent with your pricing model |
| Net profit margin | What remains after operating costs | Positive and predictable |
| Accounts receivable aging | How quickly customers pay | Mostly current, with controlled overdue balances |
| Accounts payable aging | What the business owes and when | Current, planned, and not surprising |
| Revenue concentration | How dependent revenue is on a few customers | No single customer creates an obvious threat |
Start with cash and runway
Cash on hand is the amount available in bank and cash accounts after considering restrictions and known timing issues. It matters because profit doesn't pay payroll. Cash does.
Runway translates the cash balance into time. Use a clear assumption for expected monthly cash needs, and label the result as an estimate. The common mistake is treating a high bank balance as spare cash while ignoring payroll, taxes, debt payments, and vendor bills.
Protect margin
Gross margin shows what remains after direct costs. A professional-services firm may focus on delivery labor. A contractor may include job materials and subcontractors. The useful range depends on the business model, so compare the result with your own pricing targets and past periods.
Net profit margin shows what remains after operating expenses. It catches a business that looks busy but fails to keep enough money after overhead. Don't use revenue alone as a health score. Revenue can rise while margin falls.
Watch collection and customer risk
Accounts receivable aging shows whether billed work is turning into cash. Accounts payable aging shows whether the business is keeping up with obligations. Owners often track total receivables and payables but ignore how long balances have been sitting.
Revenue concentration identifies dependence on a customer, contract, referral source, or service line. If one relationship supports a large share of sales, the dashboard should make that exposure visible before renewal or cancellation becomes a crisis.
Cash and accrual accounting can change the timing of the same sale. The IRS Publication 334 guidance explains that cash-basis businesses generally report income when payment arrives, while accrual accounting records income when it is earned. Label the accounting basis on every relevant tile.
For a practical way to examine where sales are lost through missed billing, weak follow-up, or pricing gaps, review this resource to stop revenue leaking. Then keep the dashboard focused on the few measures that lead to action. A profitability dashboard framework can help connect margin to labor, projects, receivables, and budget comparisons.
How KPIs Shift by Industry
The core seven KPIs create a base, but they won't explain every business. A dashboard for a law firm should not look like one for a clinic, a builder, or a property owner.
A study of 66 higher-education dashboards found that more than 80% contained financial indicators, with common measures connecting financial outcomes to operating drivers. The dashboard study supports a useful design choice: pair financial results with the activity that causes them.
| Industry | Add these measures | What they explain |
|---|---|---|
| Professional services | Utilization rate, project profitability | Whether time and projects produce enough margin |
| Healthcare | Days in accounts receivable by payer, collection rate | Which payers and workflows delay cash |
| Construction | Job cost variance, work in progress, retainage aging | Whether jobs and billed work match expectations |
| Real estate | Net operating income, occupancy | Property performance and space usage |
Professional services
A consulting or legal firm can show solid revenue while underbilling hours or assigning too much senior labor to routine work. Utilization rate reveals how much available delivery time becomes billable work. Project profitability shows whether a client engagement pays for the time and expense it consumes.
Healthcare
A practice may collect well from one payer and poorly from another. Days in accounts receivable by payer separates the problems, while collection rate shows whether billed services become cash. Without those measures, a general receivables total can hide a payer-specific process failure.
Construction
A contractor needs job-level detail. Job cost variance can expose labor or material overruns before completion. Work in progress helps compare earned work with billing, while retainage aging shows money that may remain tied up after work is substantially complete.
Real estate
Property owners need more than rent collected. Net operating income shows property performance before financing and ownership decisions. Occupancy adds the operating context. A property can look stable in total revenue while vacancies or concessions weaken the underlying result.
The right additions are the measures that explain movement in the core KPIs. Don't add every industry metric just because your software offers it.
Design Rules That Make a Dashboard Trustworthy
Most dashboard failures don't come from a lack of chart types. They come from unclear definitions, stale data, and screens that force the owner to guess.
A 2022 study of financial-services organizations found that visual information quality had the strongest association with data-driven decision performance, with r = 0.72 and p < 0.001, ahead of real-time capability and interactivity. The financial dashboard study points to the right priority: improve information quality before adding visual tricks.
Five rules I use with owners
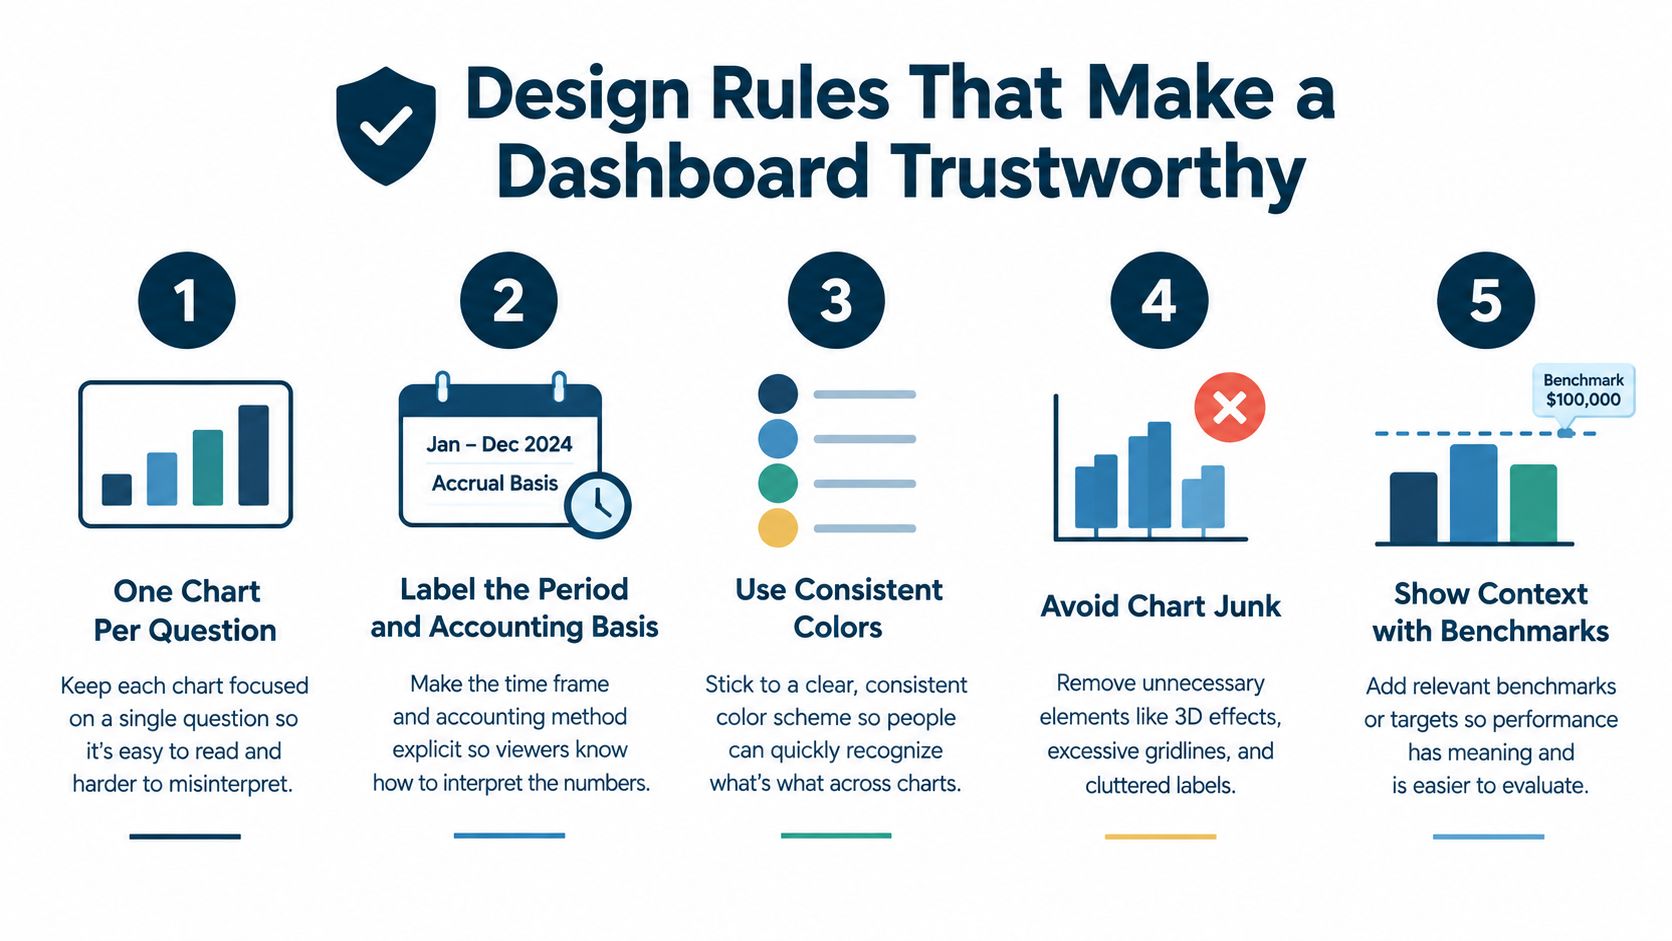
- One chart, one question. A cash trend should answer how cash is moving. A receivables table should show who owes money and how old it is. Don't make one crowded chart answer five questions.
- Label the period and basis. Every tile should say whether it shows a week, month, quarter, or year, and whether the result is cash or accrual. A number without a period is incomplete.
- Show variance and trend. A current value needs context. Compare it with budget, a prior period, or a defined target. Show whether the result is moving in the right direction.
- Drill to the transaction. If gross margin changes, the user should be able to inspect the accounts, jobs, invoices, or costs behind it. A chart that cannot be challenged is decoration.
- Use restrained color. Use two or three consistent colors. Reserve red for exceptions. Skip traffic-light gradients that make every small movement look urgent.
Add trust fields, not more widgets
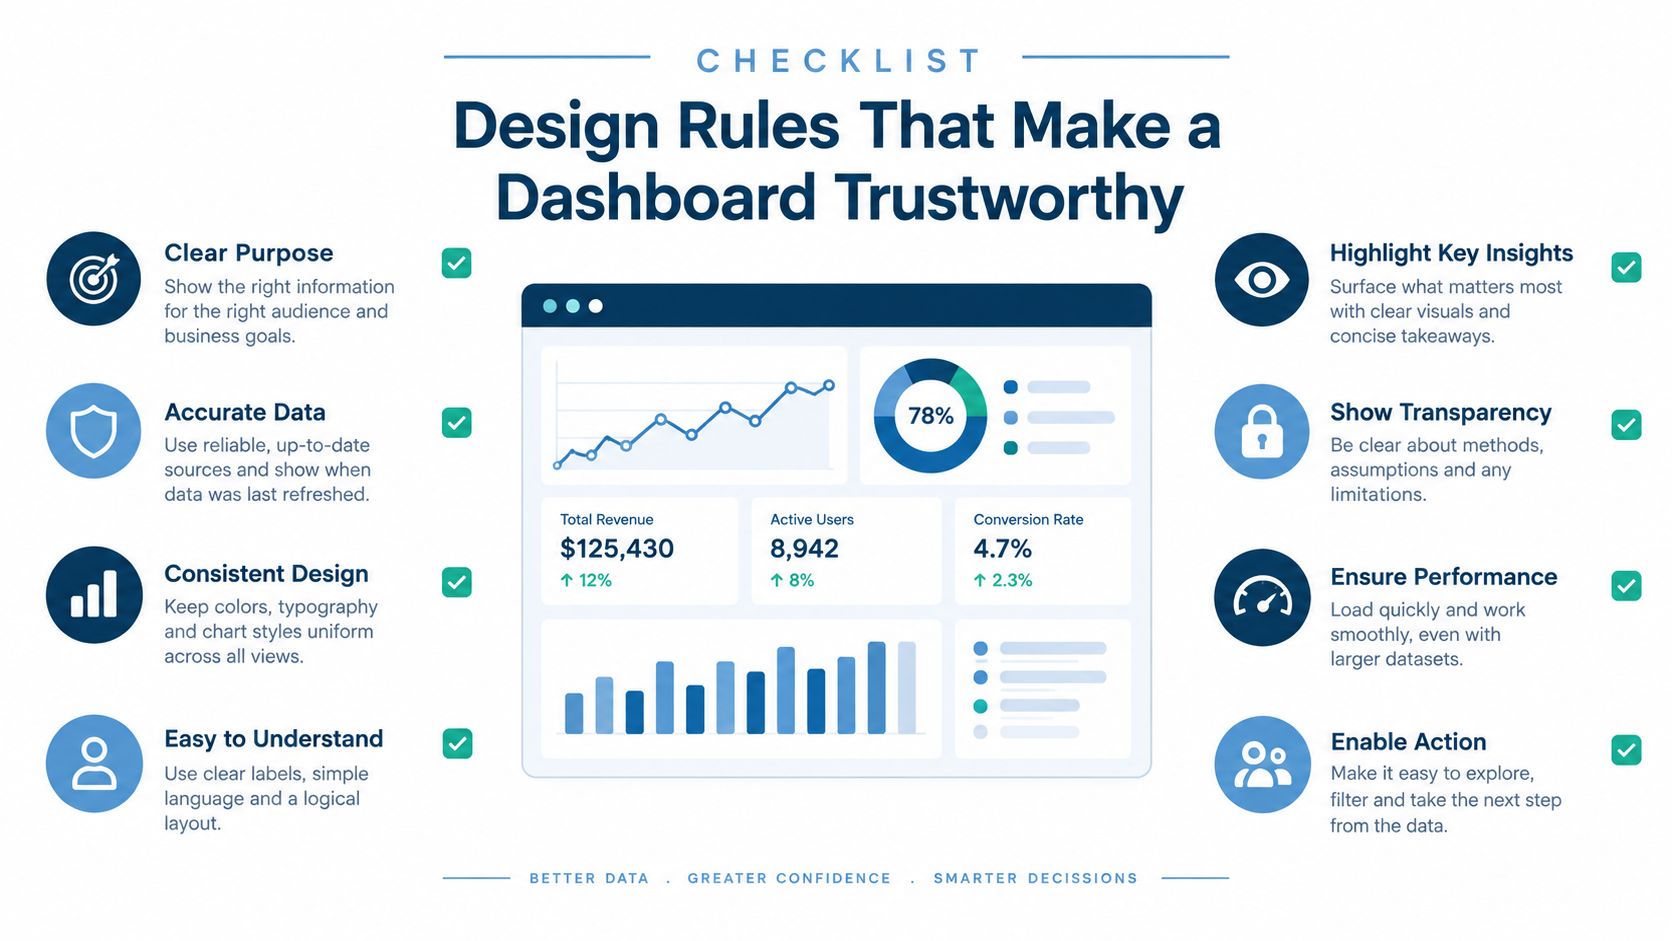
Put data source, refresh date, reconciliation status, metric owner, and variance explanation beside the KPI or in an easy-to-open detail panel. A banker should be able to ask where the number came from and get a clear answer.
Skip animations, 3D charts, decorative gauges, and dashboards that refresh faster than the books can be reconciled. Owners who want examples of practical, focused reporting interfaces can also review Micro CRM for solo consultants, especially the way simple views can keep attention on decisions instead of decoration.
Two Short Stories From Real SMB Dashboards
A twelve-person agency in West Chester had steady revenue and a growing sales pipeline. The owner assumed the year was on track. The dashboard told a different story: gross margin had slipped while revenue stayed flat.
We traced the change to pricing and delivery mix. Several projects had been sold at older rates, then staffed with more senior people than planned. The owner adjusted pricing on new work, reviewed project scope earlier, and stopped treating revenue as proof of health. The dashboard didn't predict the problem. It made the margin problem visible while there was still time to respond.

A polished screen can still lie
A contractor showed me a beautiful dashboard with clean colors, trend lines, and job rankings. The labor number was wrong. The source data was six weeks old, and no one had reconciled it against the ledger.
The dashboard suggested control because it looked finished. In reality, it hid a 20% labor-cost variance. That figure was only useful after the data age and reconciliation failure were identified, so it could be treated as an example of a dashboard warning, not a trustworthy current result.
The lesson is simple: governed and current beats attractive and stale. A 12-month field study found that replacing manual spreadsheet routines with a unified dashboard reduced the close-and-review process from 200 minutes to 80 minutes and raised reconciliation accuracy from 60% to 78%. The field study on dashboard deployment connects those gains to centralized inputs, automated calculations, and repeatable controls.
My rule: Never celebrate a real-time refresh if the underlying transactions aren't complete.
A 30-60-90 Day Plan to Build Your First Dashboard
Days 1 to 30, fix the foundation
Clean the chart of accounts, confirm how jobs, clients, departments, and locations map to the ledger, and reconcile the last three months. Decide whether each report is cash or accrual, then choose a tool that your team can maintain.
Don't start with a complicated integration. Start with the export or accounting system you already use, prove the measures, and add connections later.
Days 31 to 60, build the first view
Add the seven core KPIs and the two or three industry measures that explain them. Put one weekly review meeting on the calendar. The meeting should answer three questions: what changed, why did it change, and who will act?
A set of financial reporting templates can give your team a consistent starting structure. If you're learning the mechanics of dashboard building, this guide to interactive dashboards for beginners offers a useful introduction to working with interactive views.
Days 61 to 90, add trust and ownership
Add a data-confidence field, exception flags, and an owner for each metric. Write a short definition for every KPI. If a number changes unexpectedly, record the explanation instead of relying on memory.
Poor data quality blocks critical financial decisions for 49% of surveyed middle-market finance leaders, while 77% were prioritizing integration or optimization of existing finance technology, according to this CFO survey. That makes the data layer the first project, not a back-office detail.
MyOfficeOps can support this work through Core Accounting for the foundation, Profit Optimization for KPI analysis, and a Growth Partnership for recurring review and advisory.
Questions Owners Ask After Building a Dashboard
How do I know whether to trust a number?
Check the source, period, accounting basis, refresh date, and reconciliation status. If one is missing, treat the figure as a question, not a decision.
How often should it refresh?
Cash and collections often need frequent review. Profitability usually needs a dependable close and reconciliation cycle. Refreshing incomplete data every day creates false confidence, so match frequency to transaction volume and control quality.
What does it cost?
The cost depends on data cleanup, integrations, KPI complexity, and how much review support the business needs. A simple, governed dashboard is usually a better first purchase than a broad system no one maintains.
When should I replace it?
Retire the dashboard when definitions no longer match the business, owners stop using it, or users can't trace its numbers to source records. Fix the process first. Then replace the tool if the tool is the actual constraint.
MyOfficeOps helps small and midsize businesses clean up accounting data, build KPI and profitability dashboards, and connect reporting to decisions about cash, pricing, hiring, and growth. Visit MyOfficeOps to discuss a dashboard with clear definitions, reconciliation controls, and recurring advisory support.