
It's Thursday night. The invoices are still on the table, and the bank app says you have enough. Payroll hits tomorrow. A supplier wants money Monday. That balance is real, but it is not the whole story. A weekly forecast built from actual payment dates will tell you more than a pretty screen fed by late or messy records. Bad data can steer you worse than no dashboard at all.
What Financial Business Analytics Means in Plain Words
Think of bookkeeping as the groceries. Financial business analytics is the cooking. You take the same sales, bills, and payments, sort them, and pull out the few facts that should change what you do next. Can we hire? Can we afford the van? Which client pays us well?
Most owners are not running a giant finance team. Census data for 2023 counted 30,427,808 U.S. nonemployer establishments, and those businesses were 78.4% of all U.S. establishments. You need a short report you can read after dinner, not a binder nobody opens.
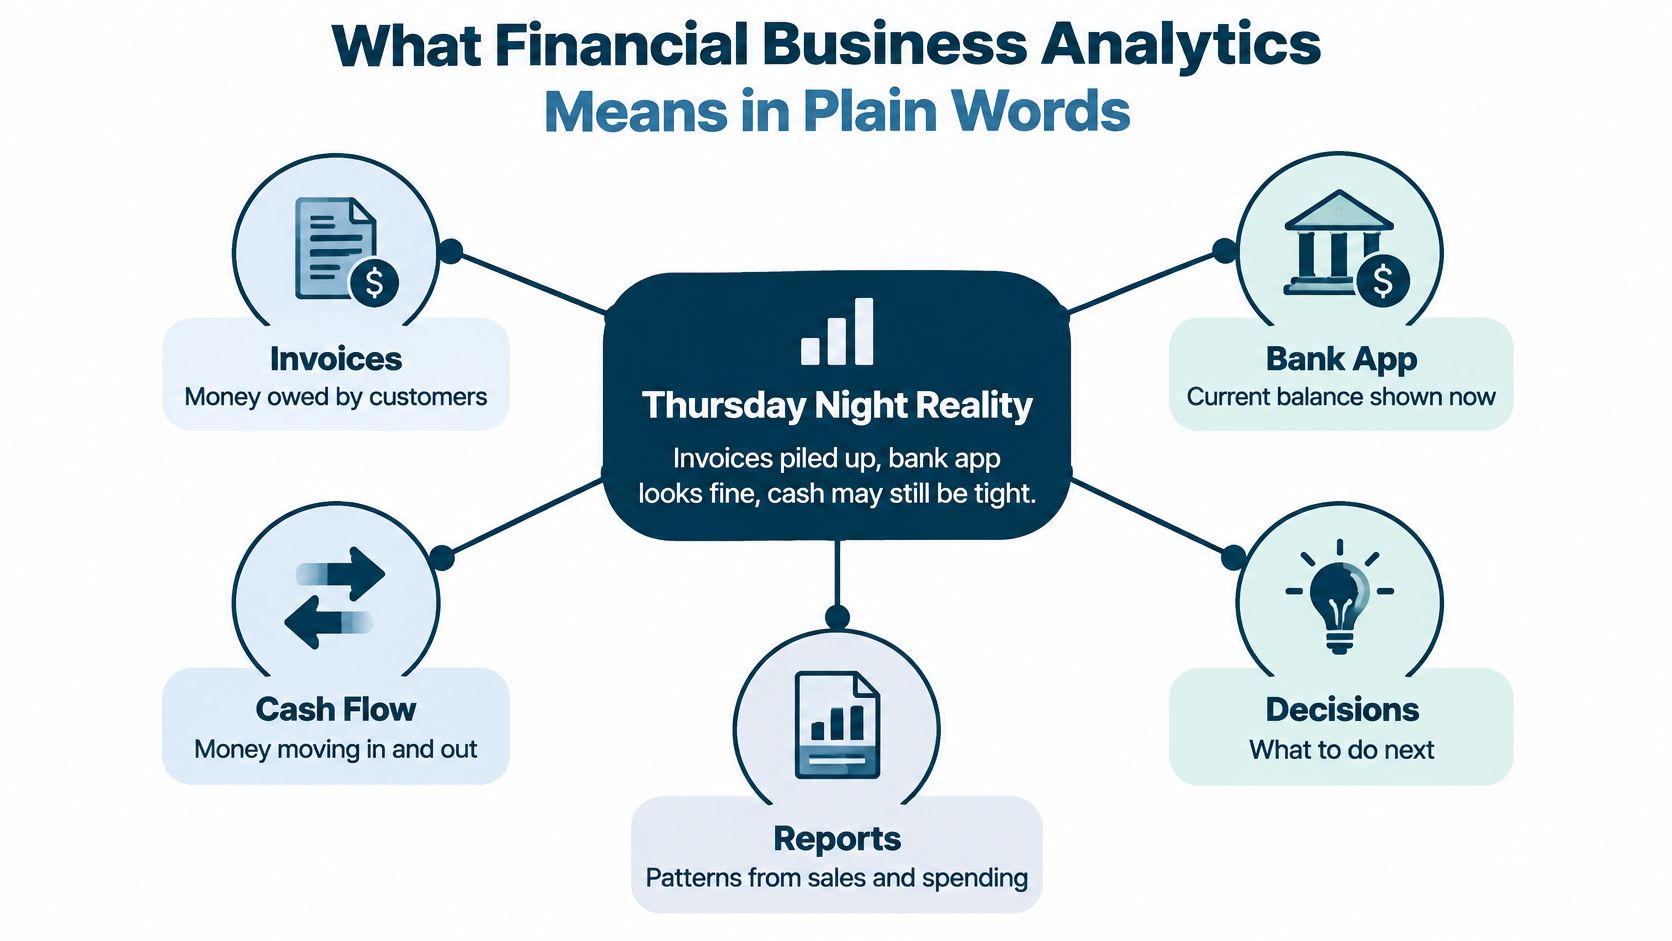
Three layers, in order
The record comes first. Every sale, bill, and payment has to land in the right place. If a deposit is labeled "miscellaneous," you can't tell later whether it was a client, a loan, or a refund.
The reports come second. A profit and loss shows what you earned. A balance sheet shows what you own and what you owe. A cash flow statement shows money moving. At MyOfficeOps we put those ideas in plain English so you can act on them, not just file them.
The decisions come third. Pricing, hiring, spending, and timing. A chart that nobody uses is decoration.
A business can look profitable and still run short of cash, because customers pay later than your bills come due. I'll walk a timing example when we build a forecast. For tonight, profit is the score. Cash is what you can spend.
Write down three money questions you could not answer last month. Keep that list. The next pages are built to answer them.
Why Two Methods Tell Two Stories
Cash accounting is your checking account. Accrual accounting is your order book. One watches money that has already moved. The other watches work you have already done, even if the check is still in the mail.
The IRS Publication 334 recognizes cash and accrual as the two common methods. Under cash, you generally report income when you receive payment and deduct expenses when you pay them. Under accrual, you generally report income when you earn it and record expenses when you incur them, even if cash has not moved yet. The IRS also requires the same method on your tax return and in your books, and that method must clearly show income. You don't get to use one story for taxes and a different story in your software just because it looks better.
| Feature | Cash method | Accrual method |
|---|---|---|
| When income is recorded | When payment is received | When it is earned |
| When expenses are recorded | When bills are paid | When they are incurred |
| Unpaid invoices on the books | Not shown | Shown as receivables |
| Best view of | Actual cash in the bank | Real performance over time |
| Medical practice example: December work paid in January | Lands in January | Lands in December |
Same clinic, two months
Say a medical practice finishes $50,000 of work in December and collects it in January. On accrual, that revenue sits in December. On cash, it sits in January. Neither number is a lie. They answer different questions. Accrual asks, "How much work did we earn?" Cash asks, "When did the money show up?"
Read them together.
- Revenue up, cash down: Look at unpaid invoices before you celebrate.
- Revenue and cash both up: Growth is more likely real, not just a timing trick.
- Cash up, revenue flat: You may be collecting old bills, not winning new work.
Before you switch methods
Ask your accountant three things, in this order. How will last year's numbers line up with this year's after the change? When do tax bills come due under the new method? Will lenders still recognize the story they already approved? I would not switch mid-year just to make one bad month look smaller. A clean comparison beats a prettier month.
The Core Numbers to Track Each Month
Start with six numbers. Track them in the same place, on the same day, every month. Ignore the rest until these are steady.
| Metric | Formula | What it tells you |
|---|---|---|
| Operating cash flow | Cash in minus cash out from daily operations | Whether the core work produces real cash |
| Days sales outstanding | Accounts receivable divided by average daily revenue | How long customers take to pay |
| Gross margin | (Revenue minus cost of sales) divided by revenue | How much each sale keeps after direct costs |
| Net profit margin | Net profit divided by revenue | What is left after all costs |
| Revenue growth | (This period revenue minus same period last year) divided by same period last year | Whether sales are really growing |
| Current ratio | Current assets divided by current liabilities | Whether short-term bills can be covered |
Why this order
Operating cash flow comes first because it answers Friday's question. Did the actual work put money in the account, or did you only book sales?
Days sales outstanding comes next. Slow payers are the leak most owners miss. If average daily revenue is $1,000 and customers owe $45,000, they are taking about 45 days. That is not a vibe. It is a calendar.
Gross margin shows whether each sale keeps enough after direct costs, such as materials, subcontractors, or the hours you bill through. A busy month with a thin gross margin is a warning, not a win.
Net profit margin is what is left after rent, software, insurance, and the owner draw you forget to count. If you only watch recurring fees, you can miss one-time jobs that look big and earn little. A plain walk-through of how to measure profitability beyond recurring revenue is worth reading before you add a new package.
Revenue growth should use the same month last year, not last month. A landscaper's April will beat March almost every time. That is the season, not a breakthrough. Pair the percent with a look at your income statement so you see which lines moved.
Current ratio is current assets divided by current liabilities. Cash and invoices you expect soon sit on one side. Bills due soon sit on the other. If the ratio slips under 1, short-term bills are larger than short-term resources.
The snapshot behind the profit report
The SBA describes the balance sheet as a snapshot of assets, liabilities, and equity. It shows what the business owns, what it owes, and how much is financed by the owner or by retained earnings. For a professional services firm, assets might be cash and unpaid client invoices. Liabilities might be card balances, payroll still owed, and loans.
Rising sales plus growing unpaid invoices often means collections are slowing, even when the profit and loss looks healthy.
Say a consulting shop books $80,000 in March, up from $70,000. Profit looks fine. Unpaid invoices jump from $20,000 to $40,000. The extra "profit" is sitting in other people's accounts. Lenders and buyers read that page because it ties results to obligations.
Don't only compare yourself with last quarter. The Census Bureau's Statistics of U.S. Businesses reports firms, employment, and annual payroll by industry and size, and it includes revenue in years ending in 2 and 7. A sales-per-employee figure means more next to a similar firm than next to your own best month.
Pick three of the six. Put them on one sheet. Compare each with last quarter before you open any other report.
Forecasting Cash Before It Runs Short
Profit tells you what you earned. Cash tells you what you can pay this Friday.
The U.S. Small Business Administration says a cash flow statement tracks both the amount and the timing of money entering and leaving. You start with the cash balance, record when customer payments arrive, record when bills and payroll must be paid, and subtract cash going out from cash coming in. A profitable firm can still run short if customers pay late while payroll, rent, or suppliers must be paid on time.
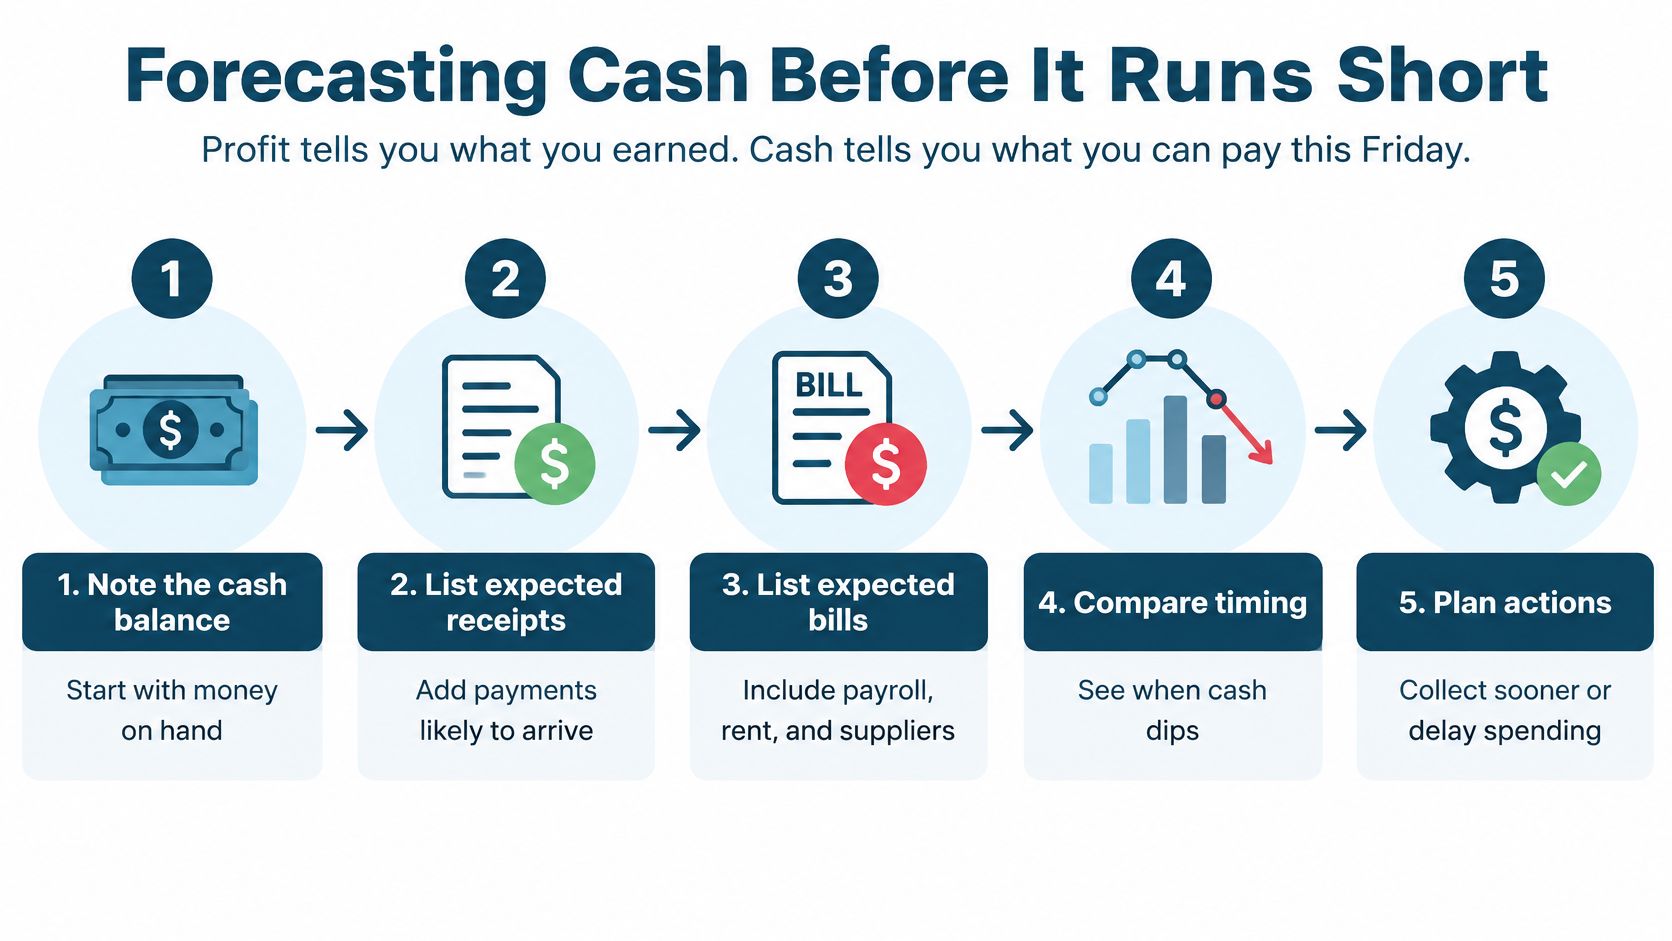
Build it in six steps
- Note the cash balance. On the same weekday, write down every account you control. Skip the savings you promised not to touch. Starting from a different day each week makes the trend wobble for no real reason.
- List expected receipts by the day they clear. Use the deposit date, not the invoice date. Card payments often land after the sale. If you take cards, the timing notes in this guide to card settlement in Singapore for 2026 show why "paid" on a terminal is not the same as "in the bank."
- List the bills with due dates. Payroll, rent, loan payments, tax deadlines, and supplier invoices. Put the date you must send the money, not the date you wish you could.
- Subtract week by week. Incoming minus outgoing. Carry each week's ending balance into the next week. One low week early in the sheet can spoil a healthy month.
- Mark the lowest week. Pick a safe minimum, such as one payroll plus rent. If the forecast dips under that line, you have a problem with a date on it.
- Build a best case and a worst case. Move two or three slow payers back by a month. If the worst case still clears payroll, you can breathe. If it doesn't, call those clients now.
A 13-week rolling view fits most small firms. It is long enough to see a dip and short enough that you are not guessing about next fall. Longer sheets feel serious and go stale.
The April gap
A consulting firm may sign a $20,000 project in March and not collect until May. Income looks strong. April still has payroll and rent. The forecast has to show whether April is covered before anyone says yes to a hire or a new laptop. The SBA notes that these statements help owners project future cash positions for hiring, equipment, and slow periods. I would not approve either spend until the low week sits above the safe minimum. If you want a short reason this habit pays off, read why cash flow forecasting belongs next to the profit report, not behind it.
Update the sheet every week. Compare last week's guess with what cleared. The misses are your lesson: a client who always pays on day 40, a tax payment you forgot, a card batch that takes three days.
Choosing Tools and Dashboards for Your Business Size
Start from the job, not the logo on the software. Most small firms need three layers. A bookkeeping system that records transactions through bank feeds. A set of reports that run on a schedule. A dashboard that shows the few numbers worth checking each week.

| Tool type | Best for | Main risk |
|---|---|---|
| Spreadsheet | Few transactions, owner updates it weekly | Errors pile up unnoticed |
| Accounting software with bank feeds | Daily bookkeeping and clean records | Only as good as the category setup |
| KPI dashboard | Weekly check on five to ten numbers | Can show stale data without warning |
| Fractional or virtual CFO | Big decisions, growth plans, pricing changes | Needs clean data before it can help |
A spreadsheet can carry a shop with a handful of deposits if you update it every week and lock last month's rows. Accounting software, whether QuickBooks or Xero, handles the daily pile, but categories set on day one stick. Review them monthly. A "Ask My Accountant" bucket that keeps growing is a hole, not a category.
A KPI dashboard is fine for a Monday glance. Check the last sync date before you trust it. If the bank feed stopped on Tuesday, Thursday's chart is a costume.
Our bookkeeping covers the day-to-day transactions. CFO advisory is the higher view: strategy, forecasting, and guidance when the choice is a loan, a second location, or a price change. A dashboard page helps only after someone owns each number. A practical financial reporting dashboard layout is five to ten figures, not forty.
Fix the inputs before you buy another tool
A 2026 study of 400 U.S. small and midsize FMCG managers measured data quality and accessibility, analytics infrastructure, analytical expertise, and predictive-modeling capability. Each had a statistically significant positive link with forecasting accuracy, with standardized effects from β = 0.108 to β = 0.239. Data-driven decisions sat in the middle of that link (indirect β = 0.067). The direct jump from "we have tools" to "we perform better" was not significant. Translation: the model is not the magic. People using clean numbers are.
Before you add software, answer four questions.
- Is the data current? Bank, cards, and payroll landed this week.
- Are categories consistent? The same bill hits the same account every month.
- Does each number have one owner? A name, not "the team."
- Does someone act on it each month? A price, a collection call, or a delayed buy.
Four yes answers means a dashboard can help. Any no means fix the records first. I would start with the cheapest fix, which is usually categories and a weekly reconcile, not a new subscription.
Cash, Profit and Forecasting in Action
Same habits, three kinds of firms. Watch the number that matches the decision, and skip the number that flatters you.

Maya's crew and the bigger jobs
Maya runs a small construction crew. She wins two larger jobs and the bank balance drops. Materials go out in week one. The client holds 10% until the end. Payroll is every Friday. She tracks retention on each job and the days between paying the crew and getting paid. The decision is to ask for progress payments before she bids the next one at the same terms. The mistake is treating a signed contract as cash. It is a promise. Her weekly sheet should show the holdback as money she cannot spend. Owners who want tighter job control can borrow ideas from smart control insights from Faberwork, then apply them to crews and materials instead of machines.
A clinic and the service that looks busy
Dr. Patel's clinic wants to know which visits earn money. Front-desk volume says physicals are the winner. She assigns staff minutes and supply cost to each visit, then compares contribution margin, not just gross fees. A popular visit that eats a nurse's whole morning can lose money once you count that time. The decision is to keep, reprice, or drop the service before she adds a new one. The mistake is ignoring overhead on a line that looks profitable because the fee is high.
A slow quarter at a small agency
Luis runs a four-person professional services firm. Two retainers end in six weeks. He builds best, base, and worst versions of the next 13 weeks and delays a hire unless the base case stays above one payroll plus rent. The numbers he watches are the low week, days sales outstanding, and the share of revenue from the top two clients. The mistake is hiring because last quarter's profit was strong. Last quarter already happened. The sheet is about the weeks still ahead.
All three owners used the same pieces: a clean record, a short list of metrics, and a forecast tied to real dates. None of them needed a wall of charts.
Turn Your Numbers Into One Decision This Month
One page. Four weeks. One decision you can defend.
Week one. Pull last month's profit and loss, balance sheet, and cash flow statement. Circle the three numbers that moved the most and write one line on why each moved. If you want a short list of what to watch and what to do about it, our free Financial Growth Guide, which you can download, covers that.
Week two. Build the 13-week cash forecast with best, base, and worst cases using actual clear dates. Mark the lowest week in red. If you can't name the date a payment lands, it does not belong in the base case. Your bank balance is the reality check in this step. A weekly sheet built from real payment dates beats a dashboard fed by entries that arrive late or land in the wrong category, and that kind of dashboard misleads you more than having none at all.
Week three. Pick one decision the numbers support: tighten collections on your slowest client, change one price, delay a hire. Write the signal that would prove you right, such as "days to pay drop under 35" or "the low week stays above $12,000." A decision with no test attached is just a mood.
Week four. Compare what happened with what you expected, then fix the data gap that slowed you down most. A bank account that does not sync. A category nobody owns. A card batch that lags three days.
Keep the review in one shared place so the same three numbers show up every month. A new spreadsheet each time is how the habit dies.
If the decision is large, a loan or a new location, have an outside accountant or a virtual CFO check the numbers before you commit.
Virtual CFO support fits when you are making a big call, planning growth, or unsure about the strategy. It checks that the sheet is honest before you sign. The weekly review still happens at your own desk.
Before next month, answer one question. Which number, if it changed by ten percent, would change what you do?
MyOfficeOps works with small and midsize owners on the parts that make this habit hold: bookkeeping that keeps records clean, financial reporting and analytics, and fractional CFO advisory for the calls that need a second set of eyes. If you want help naming the three numbers that matter in your business, visit MyOfficeOps and start with a conversation.