
You already have more data than you can use.
Your bookkeeping system has reports. Your payroll platform has labor numbers. Your CRM shows jobs, deals, or patients. Maybe you even have a dashboard someone built a year ago. But when you ask simple owner questions, the answers still feel fuzzy.
Which service line makes money? Why does revenue look solid while cash feels tight? Can you hire one more person without creating a payroll problem in two months?
That's where many small business owners get stuck. They don't have a data problem. They have a decision problem. The numbers exist, but they don't connect in a way that helps with pricing, hiring, forecasting, or profit.
That's what analytics consulting is supposed to fix.
Why Your Business Data Isn't Giving You Answers
A business owner can pull five reports before lunch and still not know what's going on.
The profit and loss statement says one thing. The CRM says another. Payroll shows overtime is rising. Project managers swear certain jobs are profitable, but the bank balance keeps saying otherwise. None of this means your team is careless. It usually means your systems were built to run tasks, not to answer owner-level questions.
The problem isn't lack of data
Small businesses often collect data in pieces. QuickBooks tracks the books. Gusto or ADP tracks payroll. HubSpot or another CRM tracks sales. A scheduling app tracks labor. A project system tracks jobs.
Each tool does its job. The trouble starts when you need one clear answer across all of them.
Most owners don't need more reports. They need one version of the truth they can trust.
A contractor might see decent monthly revenue but still not know which jobs created the best margin. A law firm might know billable hours but not whether certain clients are worth the strain on staff. A healthcare practice might see patient volume rise while collections lag behind.
Those are not software problems first. They're business interpretation problems.
Reports tell you what happened. Good analytics tells you what to do next
Business owners often waste time in this manner. They ask for another custom report, another spreadsheet tab, another dashboard widget. The pile gets bigger, but the decisions don't get easier.
A good analytics process starts by asking better questions:
- Profitability question: Which customers, services, locations, or jobs produce the healthiest margin?
- Cash flow question: What's likely to happen over the next few weeks or months if current trends continue?
- Capacity question: Are you staffed correctly, or are you carrying labor costs that revenue can't support?
- Pricing question: Are you charging enough for the work that takes the most effort?
If your current reports don't answer those questions, that's a sign you need a better reporting framework, not more noise. This is also why many owners end up looking for help with financial reporting for small business. They want clarity, not another file to review at midnight.
What Analytics Consulting Really Means for Your Business
What is analytics consulting? For a small business, it means using your existing numbers to help you make better business decisions.
That's the plain-English version.
It isn't just charts. It isn't just exporting data into Power BI or Tableau. It isn't a technical exercise done for its own sake. It's a professional service built around turning raw information into actions around pricing, cash flow, staffing, and growth.
Think pantry, not platform
Most owners already have the ingredients. Sales data. Payroll data. Job cost data. Expenses. Customer history. Accounts receivable.
Analytics consulting is the recipe and the cook. It shows how those ingredients fit together so you can answer useful questions instead of staring at separate numbers.
A pantry full of food doesn't make dinner by itself. In the same way, a stack of systems doesn't create insight by itself.
Why outside help is common
This field is a real service category, not a vague add-on. One market analysis says U.S. companies spent $23 billion on analytics in 2017, with $13 billion going to in-house capabilities and $10 billion to outside consultants. The same analysis says the U.S. analytics consulting market grew 11% in 2016 to 2017 and represented 53% of global revenues, which shows how often businesses rely on external experts to turn data into business value, according to Consulting.us on analytics consulting revenues in the U.S. market.
That split makes sense. Many small and midsize businesses don't need a full internal analytics department. They need someone who can step in, sort out the numbers, build a clean reporting structure, and connect that work to business decisions.
What it should look like in practice
A useful analytics engagement for an SMB usually helps with things like:
- Defining the right KPIs: Not vanity numbers. Real drivers like utilization, gross margin by service line, collections timing, or job profitability.
- Cleaning up conflicting data: Making sure payroll, bookkeeping, and sales reports use the same definitions.
- Building decision tools: Dashboards, forecasts, and recurring reporting that support weekly and monthly choices.
- Connecting analysis to action: Hiring plans, pricing updates, budget changes, and owner distributions.
If you're trying to decide whether this belongs under accounting, finance, or strategy, the honest answer is all three. That's also why many owners looking for analytics support end up exploring CFO services for small business. The value isn't in the chart. The value is in what you decide after reading it.
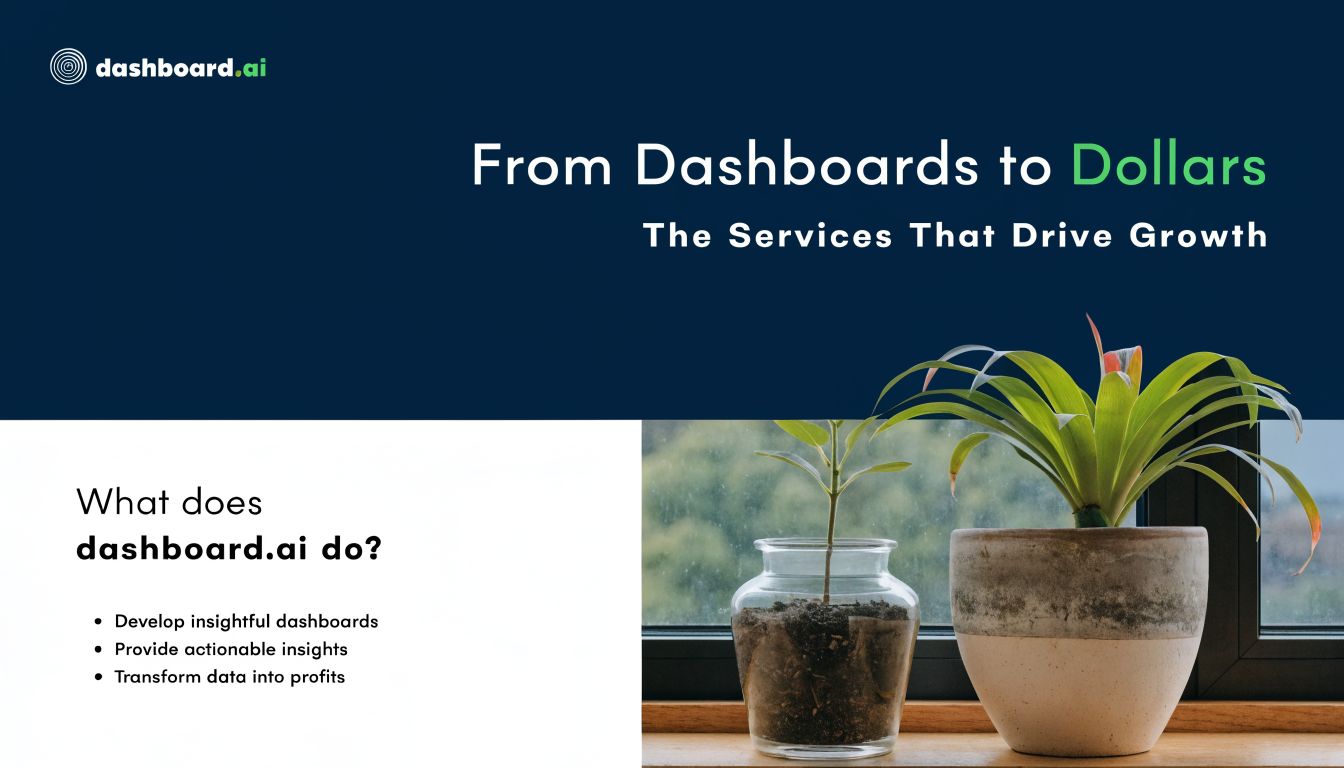
From Dashboards to Dollars The Services That Drive Growth
The best analytics work solves a business problem you can feel.
If a report looks polished but doesn't help you protect margin, collect cash faster, or plan hiring with more confidence, it's decoration. Small businesses need analytics that moves from dashboard to decision.
Customized reporting
This is the basic layer. It means building reports around how your business runs, not how the software vendor thinks you should view it.
A professional services firm might need revenue by client, by service line, and by team member. A contractor might need cost reports by job phase. A healthcare group might need provider productivity tied to collections and payroll.
When those reports are customized for real decisions, owners stop asking, “What am I looking at?” and start asking, “What should we change?”
KPI dashboards
A dashboard gives you a short list of numbers worth watching every week.
That can be useful. It can also be useless if the metrics are too broad. “Revenue” alone rarely helps. “Revenue compared to labor cost by team” is more helpful. “Average days to collect” tells a better story than just “accounts receivable balance.”
Practical rule: If a dashboard doesn't change a meeting, it probably doesn't need to exist.
Some teams use Microsoft Power BI. Others use Tableau. Many SMBs do fine with simpler reporting layers that pull from accounting, payroll, and CRM systems without overbuilding the solution. If you want a grounded example of how dashboards can support efficient financial tracking for New Zealand SMEs, that resource shows the same core idea: the dashboard matters only if it helps owners track profit clearly.
Cash flow forecasting
Analytics begins to function as advisory work.
Cash flow forecasting uses your historical patterns, current receivables, payroll obligations, and expected sales activity to show what's likely to happen next. For an owner, that means fewer blind spots around tax payments, payroll timing, hiring, and major purchases.
A growing agency might look profitable on paper and still hit a cash squeeze because clients pay late. A forecast can surface that issue early enough to adjust billing terms, collections follow-up, or spending.
Profitability analysis
This is often the highest-value service because it gets right to the point. Where are you making money?
A construction company may learn that one type of project produces stronger margins because change orders are managed better. A clinic may see that one service line creates volume but weak cash performance. An IT firm may find that a few legacy clients absorb too much staff time for too little return.
Analytics work aimed at process automation or decision bottlenecks can produce measurable ROI within 3 to 6 months because it cuts manual reporting work and helps prevent margin leakage, overstaffing, and cash shortfalls, as described in SR Analytics on how data analytics consulting supports business growth.
For owners who are buried in spreadsheets, that timeline matters. You don't need a massive transformation. You need a tighter feedback loop and better decisions. In some cases, firms use a provider such as MyOfficeOps for financial reporting automation when they want cleaner recurring reporting tied to bookkeeping and advisory support.
The Analytics Engagement Process From Start to Finish
Most owners hesitate to hire an analytics consultant for one simple reason. They think it will become a long, technical project that eats time and produces confusion.
A good process should feel the opposite. It should be structured, understandable, and tied to your business priorities from day one.
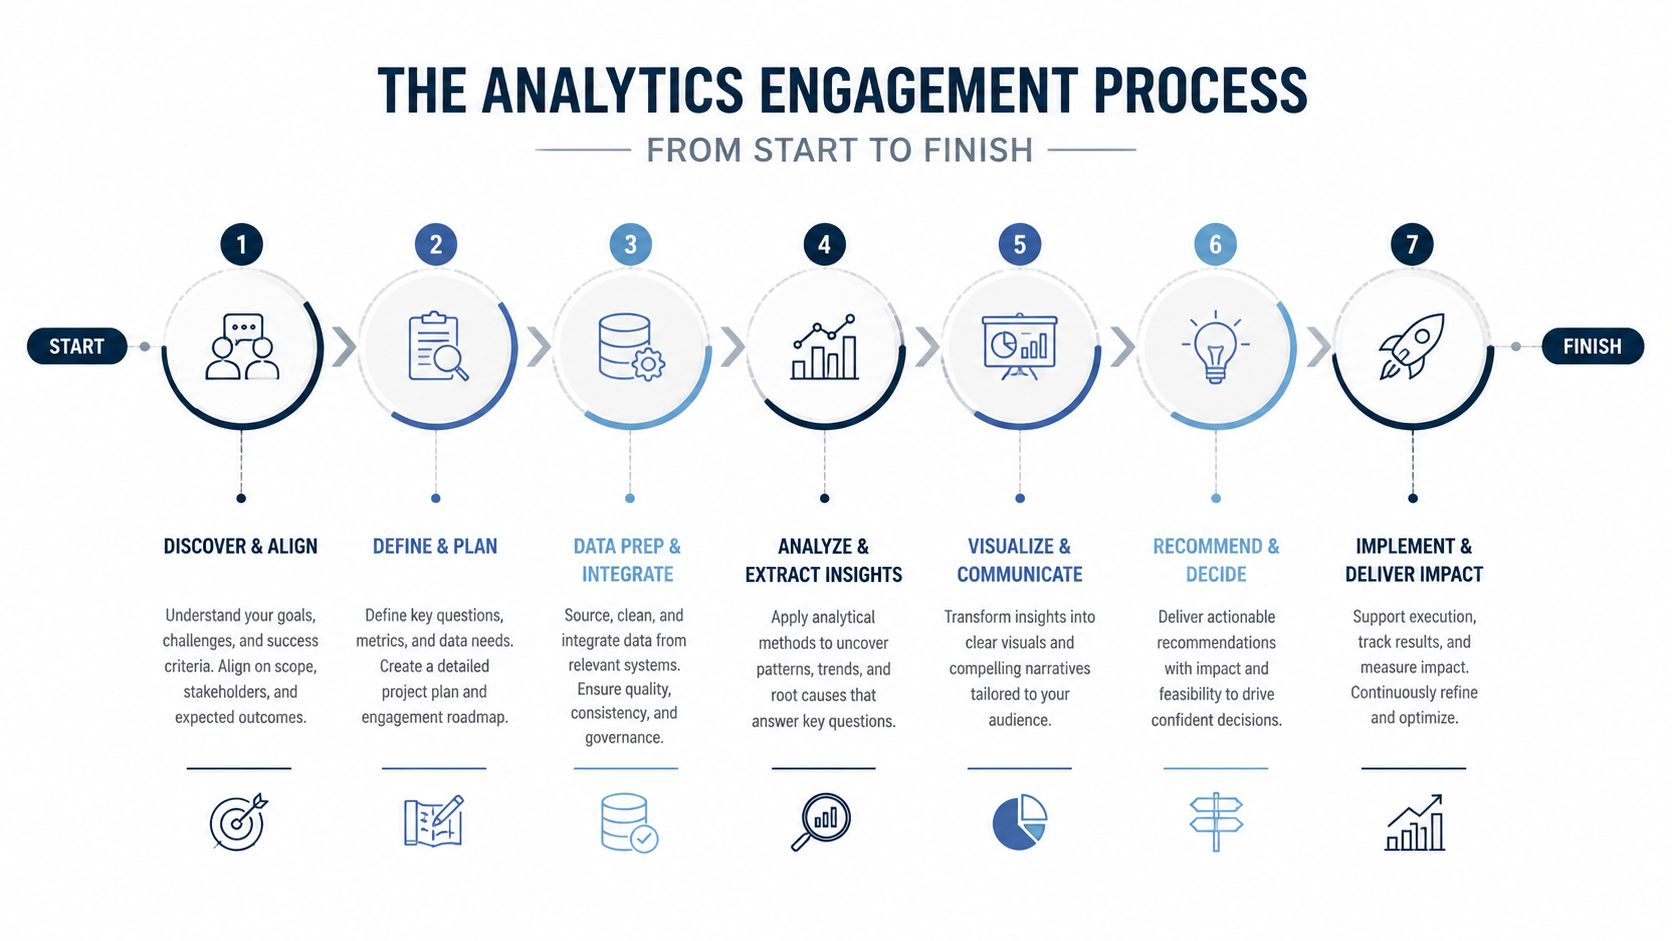
Discovery and business priorities
The first step isn't software. It's context.
A useful consultant starts by asking what decisions are hard right now. Maybe your issue is cash volatility. Maybe you can't tell which jobs make money. Maybe you're growing and don't know when to add staff. The work should begin with those questions, not with a generic pitch about dashboards.
This stage usually surfaces something important. Different people in the company often define the same metric in different ways. Sales calls one thing “booked revenue.” Accounting uses another definition. Operations tracks labor differently than payroll.
That mismatch is one reason owners feel like every meeting ends in debate.
Data audit and cleanup
A typical analytics project follows a clear technical pipeline. Consultants audit the existing data sources, build a clean data foundation, and then apply models or create visualizations. For SMBs, that matters because bookkeeping, payroll, and CRM systems often create fragmented data and conflicting reports, as explained in Data Ideology's overview of the data analytics consulting pipeline.
In plain language, this is the cleanup phase.
It may involve:
- Checking source systems: Reviewing QuickBooks, Xero, payroll tools, CRMs, scheduling systems, or job-cost platforms
- Standardizing definitions: Agreeing on what counts as revenue, direct labor, backlog, utilization, or gross margin
- Fixing data quality issues: Removing duplicates, filling gaps, and correcting category mistakes
- Creating a usable structure: Setting up a warehouse, ETL or ELT process, or a lighter reporting model that can feed a dashboard reliably
Reporting, forecasting, and review
Once the foundation is solid, the outputs get built.
That could be a weekly KPI dashboard in Power BI, a monthly profitability review, a rolling cash flow forecast, or a board-ready reporting package. The important part is that the output matches how you run the business.
Clean data isn't the finish line. It's the ground you stand on before making decisions.
The final piece is the review rhythm. Good analytics work includes regular conversations about what changed, why it changed, and what action makes sense now. Without that step, many projects drift back into passive reporting.
How to Choose the Right Analytics Partner
Not every analytics provider is built for small business reality.
Some firms are excellent at enterprise systems and still a poor fit for an owner who needs help deciding whether to raise prices, change staffing, or tighten collections. The right partner should understand numbers, but they also need to understand how owners make decisions under pressure.

Look for business judgment, not just tooling
The market for these services is still expanding. IndustryARC projects the Big Data Consulting market will reach $36,751.2 million by 2030, with North America holding 36% of market share in 2023, according to IndustryARC's big data consulting market outlook. That growth means you'll see more firms offering analytics help.
More options is good. It also means you need to filter carefully.
A consultant can be very capable with SQL, BI tools, and data models and still fall short if they can't connect the work to pricing, hiring, margin, or cash. For a construction firm, they should understand job costing. For a healthcare practice, they should know that collections timing matters as much as volume. For a professional services firm, they should be comfortable discussing utilization, realization, and client mix.
Questions worth asking before you sign
Use a short checklist. The answers will tell you a lot.
- Ask for a relevant example: Can you show a sample dashboard or reporting package for a business like mine?
- Test decision support: After you build the report, how do you help us decide what to do with it?
- Clarify data sources: Which systems can you connect, and how do you handle conflicting numbers?
- Discuss meeting cadence: Will we review this monthly, quarterly, or only at setup?
- Ask about pricing structure: Is this project-based, ongoing retainer support, or a mix of both?
- Check communication style: Can you explain findings in plain English to non-technical owners?
If a consultant spends most of the sales call talking about tools and very little time talking about your business model, keep looking.
A quick fit test
Here is a simple way to understand it:
| What you hear | What it usually means |
|---|---|
| “We build dashboards” | Useful, but incomplete |
| “We clean data and define KPIs” | Better foundation |
| “We help you use those KPIs to make pricing, hiring, and cash decisions” | Stronger partner fit |
The best partner acts more like a financial translator than a software vendor.
Your Next Step Toward a Data-Driven Business
A lot of owners think analytics starts with better software.
Usually, it starts with a better question.
Which customers are worth more attention? Where is margin slipping? What happens to cash if payroll rises before collections catch up? Those are the questions that turn analytics from a reporting task into a business tool.
What usually goes wrong
Many analytics consulting engagements miss the mark for SMBs because they focus too narrowly on reporting or tools, instead of building the systems and strategy that turn data into impact. That gap matters most when owners need help connecting analytics to pricing, cash flow, and profitability, as noted in Experian's analytics consulting perspective.
That problem shows up all the time in small business settings. A dashboard gets built. A few meetings happen. Then the tool sits there because no one tied it to real decisions.
The fix is simple to describe and harder to execute. Your reporting has to connect to how you run the company.
What good looks like
Good analytics consulting gives you a clearer view of the business you already have. It helps you see profit by customer, service, or job. It helps you plan before cash gets tight. It helps you hire with more confidence and price work with fewer guesses.
It also gives you a stronger business over time. Cleaner reporting and better forecasting don't just reduce stress. They support more disciplined growth and a more valuable company if you ever want to sell, transition, or bring in outside capital.
If you've been looking at reports and still feel unsure about what the numbers are telling you, that's not a sign you're missing something obvious. It's usually a sign the system hasn't been built around the decisions you need to make.
If you want help turning scattered numbers into clear decisions, MyOfficeOps works with small and midsize businesses on bookkeeping, financial analytics, and CFO-level advisory. A simple first step is a conversation about where your reporting breaks down today, what decisions feel hardest right now, and what a cleaner path forward could look like.